| Well Information Table |
|---|
| Common Well ID | CB00207525AAB |
| USGS Well ID | 370625105440001 |
| USGS Station Name | CB00207525AAB |
| USGS Construction Date | 01/01/1955 |
| USGS Site Type | Well |
| USGS Site Use Information | Unused |
| USGS Groundwater Use Information | Unused |
| Data Source(s) | USGS |
| Location Data |
|---|
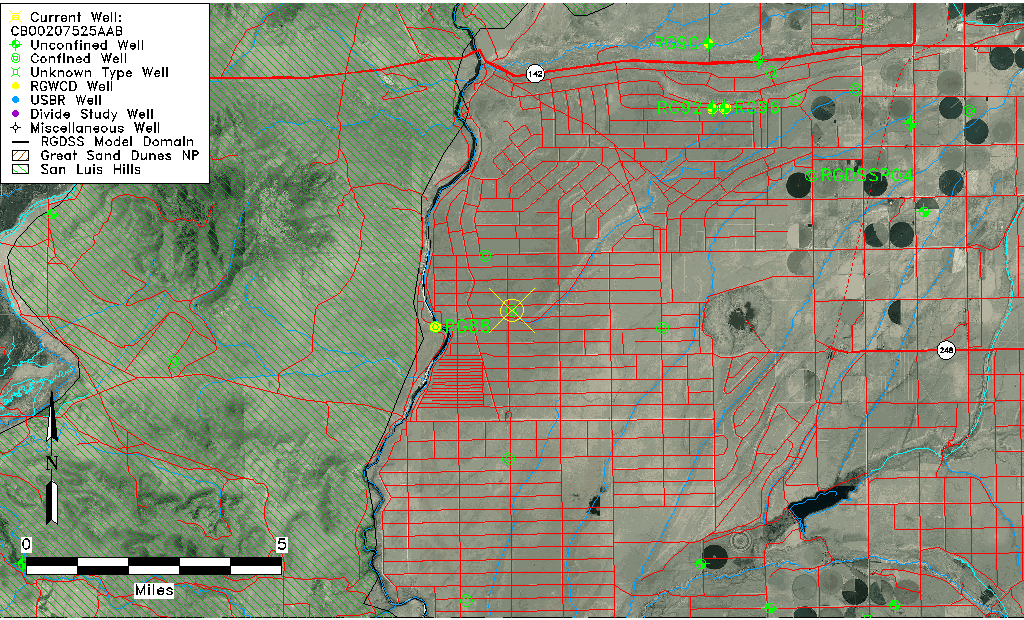
| TRS | CB00207525AAB |
| USGS TRS 1 | CB00207525AAB |
| USGS TRS | NWNENES025T0002NR0075WC |
| Longitude/Latitude (NAD83) | -105.71823780 , 37.10957119 |
| Longitude/Latitude Data Source | GWSI decimal LAT/LONG field |
| USGS Longitude/Latitude (NAD83) | -105.7182378 , 37.10957119 |
| Easting, Northing RGDSS-NAD83 (US ft) | 187126.73 , 41402.27 |
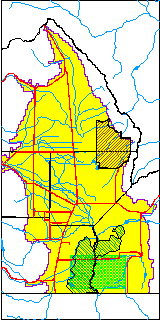
| USGS County | Costilla County |
| Elevation and Depth Data |
|---|
| Ground Elevation (ft NAVD88) | 7505.03000000000 |
| Elevation Data Source | USGS GWSI database |
| USGS Ground Elevation (ft NGVD29) | 7501.00 |
| 1/3-Arc Second NED Ground Elevation (ft NAVD88) | 7504.87 |
| 1-Arc Second NED Ground Elevation (ft NAVD88) | 7501.96 |
| SRTM Ground Elevation (ft NAVD88) | 7493.95 |
| Total Depth (ft) | 210.00 |
| USGS Well Depth (ft) | 210.00 |
| Model Layer | 2 |
| Model Layer Source | Well Depth |
| Depth of Bottom of Layer 1 | 113 |
| Depth of Bottom of Layer 2 | 213 |
| Depth of Bottom of Layer 3 | 402 |
| Depth of Bottom of Layer 4 | 691 |
| Additional Well Information | Geohydrology, Construction |
| Aquifer Information |
|---|
| Aquifer Type | Confined |
| Aquifer Type Source | TD Elevation/Model Layer |
| USGS Primary Aquifer | Cenozoic Erathem |
| USGS Aquifer Type | Unconfined Single Aquifer |
| USGS Hydrologic Unit | Alamosa-Trinchera |
| USGS Data Available | Water-level (GW.LEV) |
| Water-level Database Information |
|---|
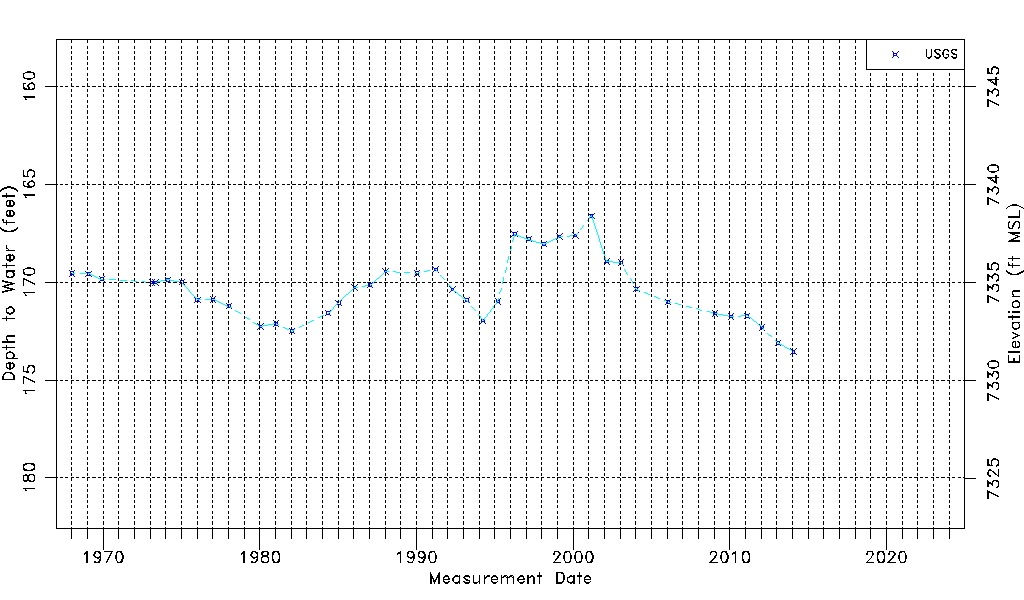
| Water-level Count | 40 |
| Water-level Date Range | 01/12/1968 thru 01/29/2014 |
| Monitored within the last 18 months | No, most recently on 01/29/2014 |
| Depth-to-Water Range (ft) | 166.61 to 173.55 |
| Water Table Elevation Range (ft NAVD88) | 7331.48 to 7338.42 |
| Water-Level-Source:Number-of-Measurements | USGS:40 |