| Well Information Table |
|---|
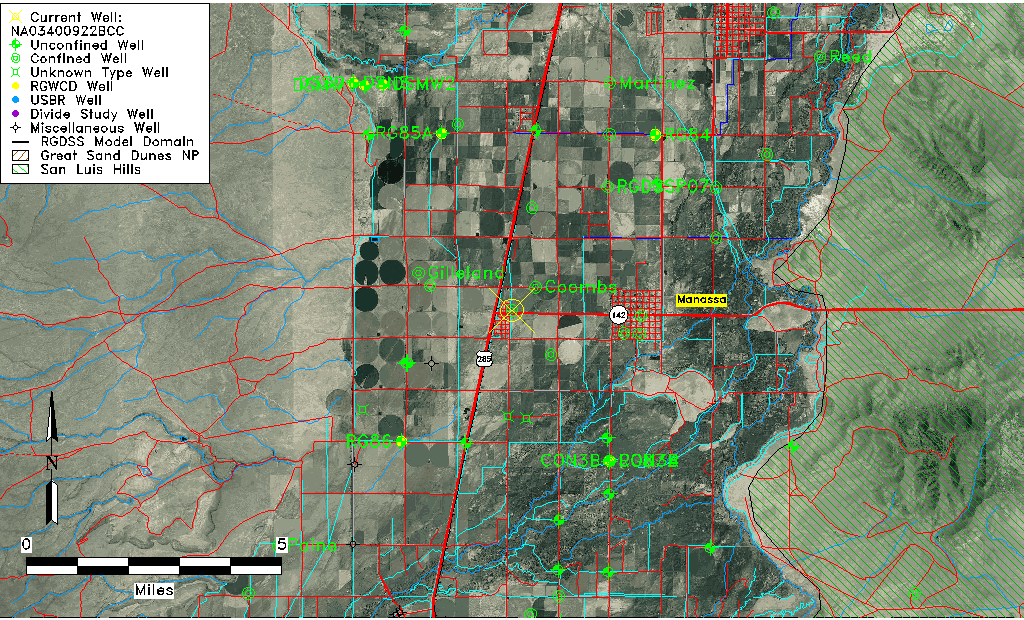
| Common Well ID | NA03400922BCC |
| USGS Well ID | 371030105585001 |
| USGS Station Name | NA03400922BCC |
| USGS Construction Date | 01/01/1962 |
| USGS Site Type | Well |
| USGS Site Use Information | Withdrawal of Water |
| USGS Groundwater Use Information | Irrigation |
| Data Source(s) | USGS |
| Location Data |
|---|
| TRS | NA03400922BCC |
| USGS TRS 1 | NA03400922BCC |
| USGS TRS | SWSWNWS022T0034NR0009EN |
| Longitude/Latitude (NAD83) | -105.98113370 , 37.17501050 |
| Longitude/Latitude Data Source | GWSI decimal LAT/LONG field |
| USGS Longitude/Latitude (NAD83) | -105.9811337 , 37.17501050 |
| Easting, Northing RGDSS-NAD83 (US ft) | 110564.94 , 65361.73 |
| USGS Topography | Valley flat |
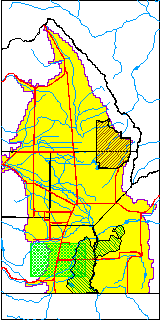
| USGS County | Conejos County |
| Elevation and Depth Data |
|---|
| Ground Elevation (ft NAVD88) | 7731.07000000000 |
| Elevation Data Source | USGS GWSI database |
| USGS Ground Elevation (ft NGVD29) | 7727.00 |
| 1/3-Arc Second NED Ground Elevation (ft NAVD88) | 7730.02 |
| 1-Arc Second NED Ground Elevation (ft NAVD88) | 7726.01 |
| SRTM Ground Elevation (ft NAVD88) | 7729.80 |
| Total Depth (ft) | 596.00 |
| USGS Well Depth (ft) | 596.00 |
| Model Layer | 4 |
| Model Layer Source | Well Depth |
| Depth of Bottom of Layer 1 | 37 |
| Depth of Bottom of Layer 2 | 213 |
| Depth of Bottom of Layer 3 | 357 |
| Depth of Bottom of Layer 4 | 1573 |
| Additional Well Information | Geohydrology, Construction |
| Aquifer Information |
|---|
| Aquifer Type | Confined |
| Aquifer Type Source | TD Elevation/Model Layer |
| USGS Primary Aquifer | Cenozoic Erathem |
| USGS Hydrologic Unit | Alamosa-Trinchera |
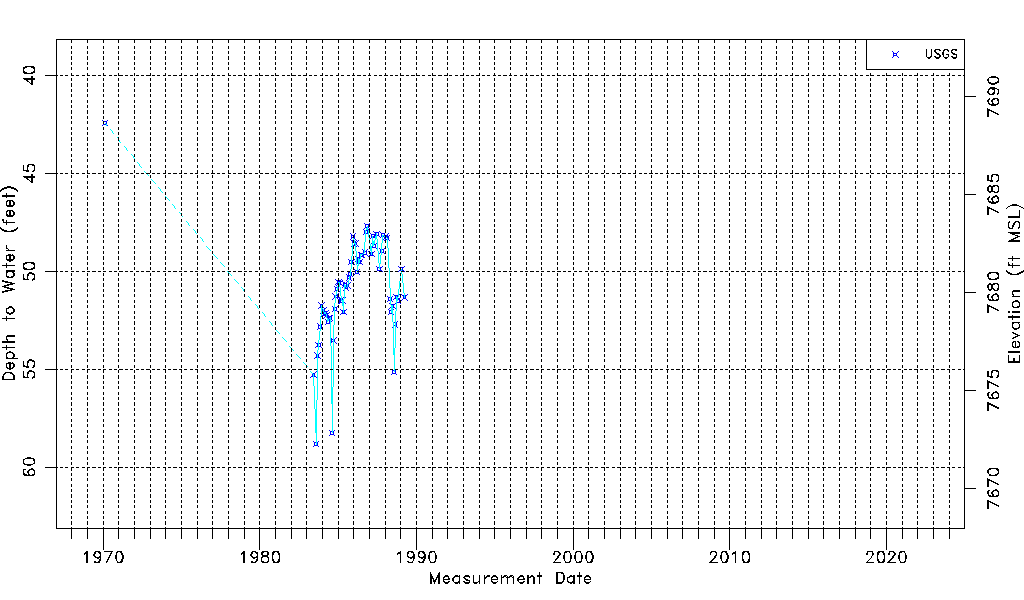
| USGS Data Available | Water-level (GW.LEV) |
| Water-level Database Information |
|---|
| Water-level Count | 59 |
| Water-level Date Range | 02/19/1970 thru 03/28/1989 |
| Monitored within the last 18 months | No, most recently on 03/28/1989 |
| Depth-to-Water Range (ft) | 42.44 to 58.83 |
| Water Table Elevation Range (ft NAVD88) | 7672.24 to 7688.63 |
| Water-Level-Source:Number-of-Measurements | USGS:59 |