| Well Information Table |
|---|
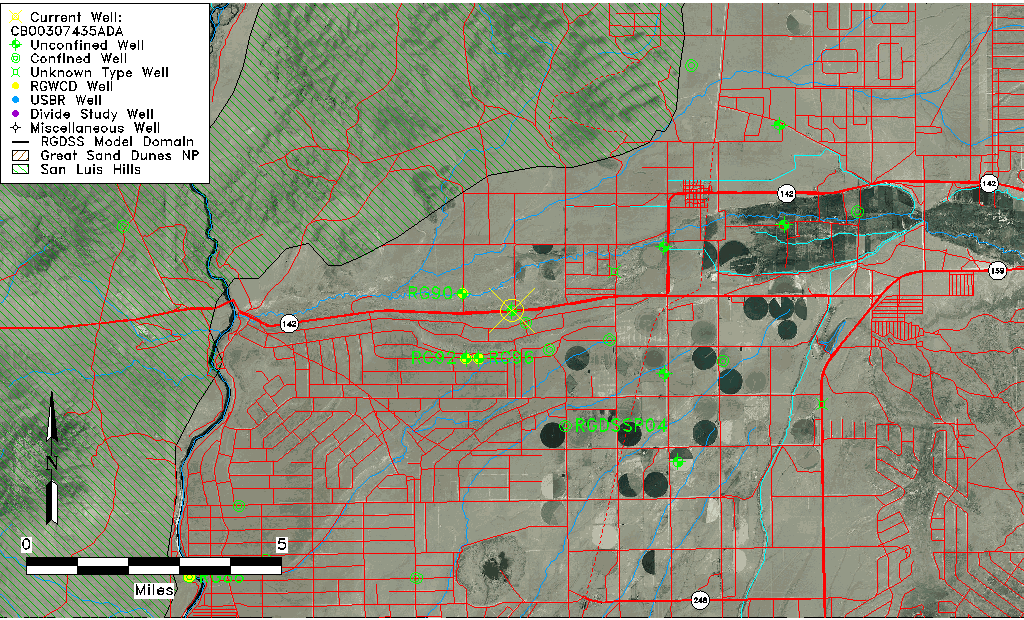
| Common Well ID | CB00307435ADA |
| USGS Well ID | 371057105380001 |
| USGS Station Name | CB00307435ADA |
| USGS Site Type | Well |
| USGS Site Use Information | Observation |
| USGS Groundwater Use Information | Unused |
| Data Source(s) | USGS |
| Location Data |
|---|
| TRS | CB00307435ADA |
| USGS TRS 1 | CB00307435ADA |
| USGS TRS | NESENES035T0003NR0074WC |
| Longitude/Latitude (NAD83) | -105.63098700 , 37.18054190 |
| Longitude/Latitude Data Source | GWSI decimal LAT/LONG field |
| USGS Longitude/Latitude (NAD83) | -105.6309870 , 37.18054190 |
| Easting, Northing RGDSS-NAD83 (US ft) | 212548.95 , 67234.39 |
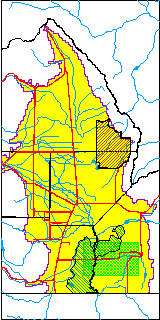
| USGS County | Costilla County |
| Elevation and Depth Data |
|---|
| Ground Elevation (ft NAVD88) | 7592.19000000000 |
| Elevation Data Source | USGS GWSI database |
| USGS Ground Elevation (ft NGVD29) | 7588.00 |
| 1/3-Arc Second NED Ground Elevation (ft NAVD88) | 7593.97 |
| 1-Arc Second NED Ground Elevation (ft NAVD88) | 7594.56 |
| SRTM Ground Elevation (ft NAVD88) | 7596.96 |
| Total Depth (ft) | 52.00 |
| USGS Well Depth (ft) | 52.00 |
| Model Layer | 1 |
| Model Layer Source | Well Depth |
| Depth of Bottom of Layer 1 | 177 |
| Depth of Bottom of Layer 2 | 277 |
| Depth of Bottom of Layer 3 | 625 |
| Depth of Bottom of Layer 4 | 1051 |
| Additional Well Information | Geohydrology, Construction |
| Aquifer Information |
|---|
| Aquifer Type | Unconfined |
| Aquifer Type Source | TD Elevation/Model Layer |
| USGS Primary Aquifer | Cenozoic Erathem |
| USGS Aquifer Type | Unconfined Single Aquifer |
| USGS Hydrologic Unit | Alamosa-Trinchera |
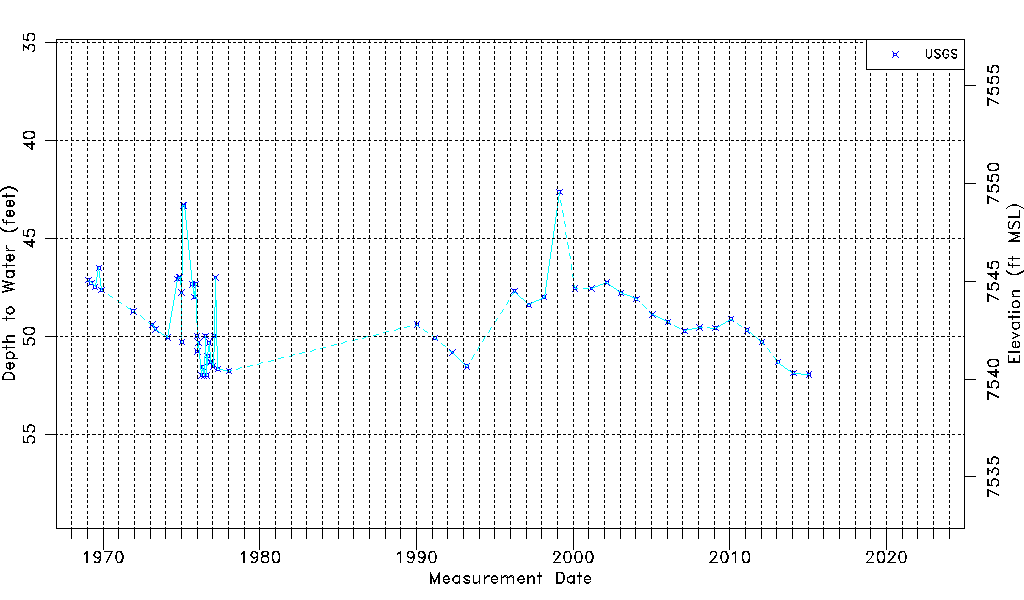
| USGS Data Available | Water-level (GW.LEV) |
| Water-level Database Information |
|---|
| Water-level Count | 60 |
| Water-level Date Range | 01/28/1969 thru 01/21/2015 |
| Monitored within the last 18 months | No, most recently on 01/21/2015 |
| Depth-to-Water Range (ft) | 42.64 to 52.00 |
| Water Table Elevation Range (ft NAVD88) | 7540.19 to 7549.55 |
| Water-Level-Source:Number-of-Measurements | USGS:60 |