| Well Information Table |
|---|
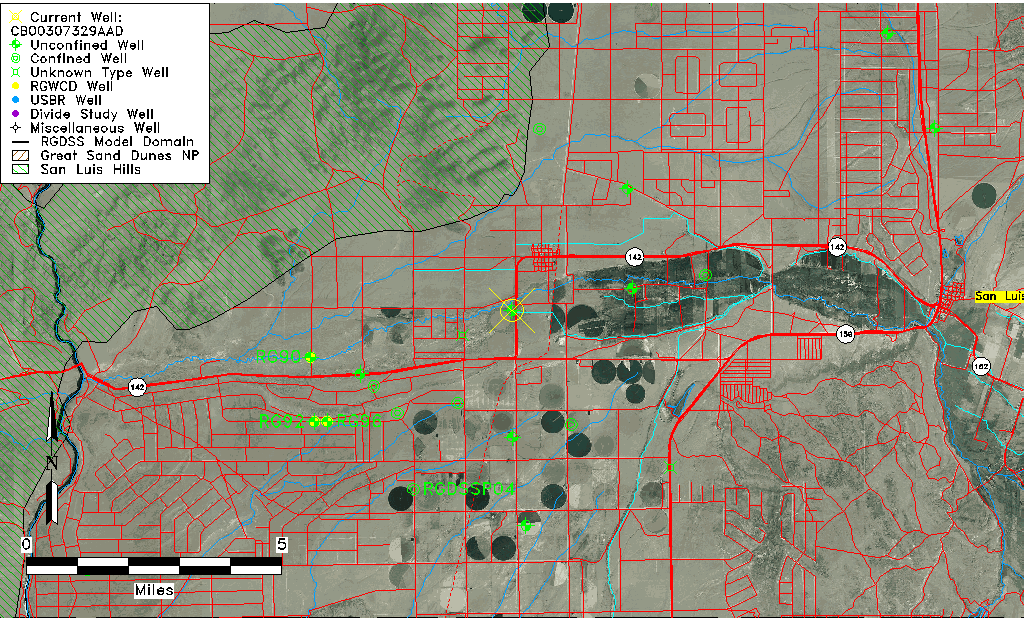
| Common Well ID | CB00307329AAD |
| USGS Well ID | 371155105344001 |
| USGS Station Name | CB00307329AAD |
| USGS Construction Date | 01/01/1965 |
| USGS Site Type | Well |
| USGS Site Use Information | Withdrawal of Water |
| USGS Groundwater Use Information | Irrigation |
| Data Source(s) | USGS |
| Location Data |
|---|
| TRS | CB00307329AAD |
| USGS TRS 1 | CB00307329AAD |
| USGS TRS | SENENES029T0003NR0073WC |
| Longitude/Latitude (NAD83) | -105.57709730 , 37.19854179 |
| Longitude/Latitude Data Source | GWSI decimal LAT/LONG field |
| USGS Longitude/Latitude (NAD83) | -105.5770973 , 37.19854179 |
| Easting, Northing RGDSS-NAD83 (US ft) | 228236.70 , 73797.72 |
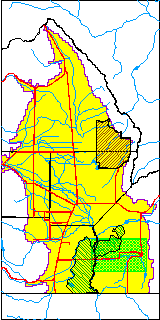
| USGS County | Costilla County |
| Elevation and Depth Data |
|---|
| Ground Elevation (ft NAVD88) | 7679.25000000000 |
| Elevation Data Source | USGS GWSI database |
| USGS Ground Elevation (ft NGVD29) | 7675.00 |
| 1/3-Arc Second NED Ground Elevation (ft NAVD88) | 7679.89 |
| 1-Arc Second NED Ground Elevation (ft NAVD88) | 7679.29 |
| SRTM Ground Elevation (ft NAVD88) | 7678.64 |
| Total Depth (ft) | 150.00 |
| USGS Well Depth (ft) | 150.00 |
| Model Layer | 1 |
| Model Layer Source | Well Depth |
| Depth of Bottom of Layer 1 | 222 |
| Depth of Bottom of Layer 2 | 322 |
| Depth of Bottom of Layer 3 | 724 |
| Depth of Bottom of Layer 4 | 1196 |
| Additional Well Information | Geohydrology, Construction |
| Aquifer Information |
|---|
| Aquifer Type | Unconfined |
| Aquifer Type Source | TD Elevation/Model Layer |
| USGS Primary Aquifer | Cenozoic Erathem |
| USGS Aquifer Type | Unconfined Single Aquifer |
| USGS Hydrologic Unit | Alamosa-Trinchera |
| USGS Data Available | Water-level (GW.LEV) |
| Water-level Database Information |
|---|
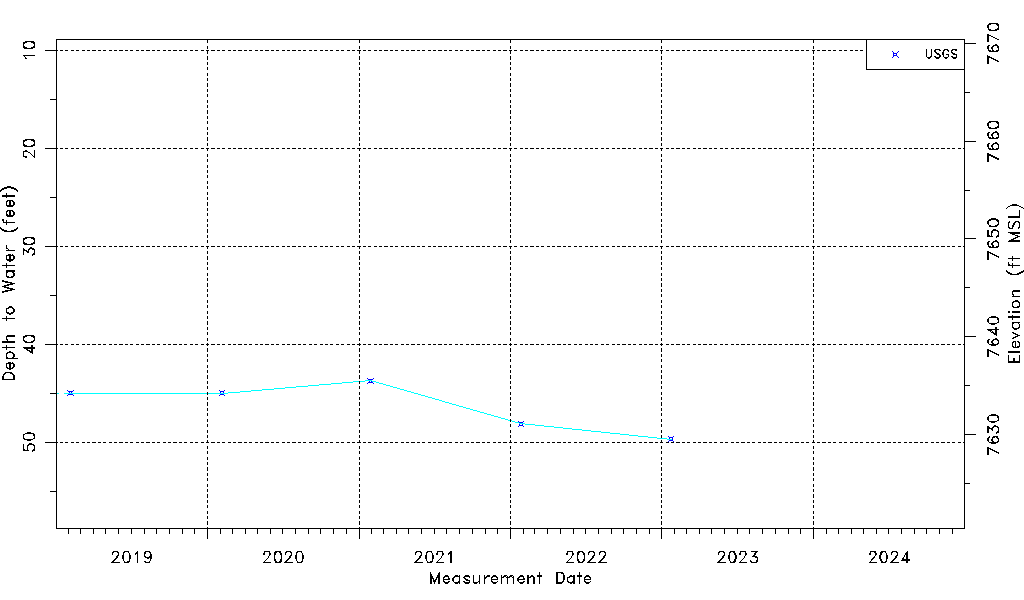
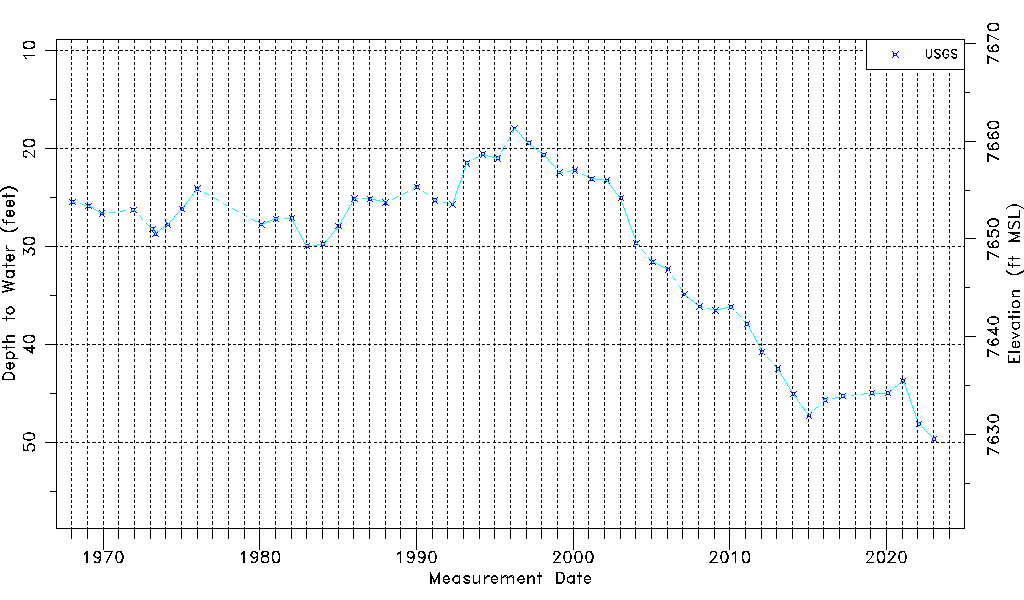
| Water-level Count | 51 |
| Water-level Date Range | 01/16/1968 thru 01/23/2023 |
| Monitored within the last 18 months | Yes, most recently on 01/23/2023 |
| Depth-to-Water Range (ft) | 17.95 to 49.69 |
| Water Table Elevation Range (ft NAVD88) | 7629.56 to 7661.30 |
| Water-Level-Source:Number-of-Measurements | USGS:51 |