| Well Information Table |
|---|
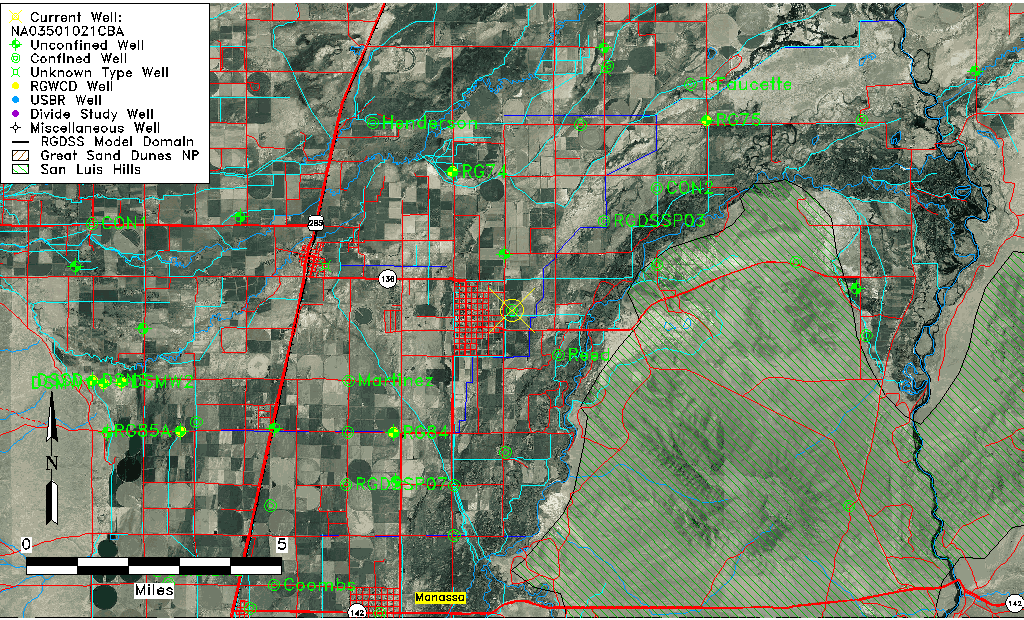
| Common Well ID | NA03501021CBA |
| USGS Well ID | 371535105531701 |
| USGS Station Name | NA03501021CBA |
| USGS Construction Date | 1964 |
| USGS Site Type | Well |
| USGS Site Use Information | Withdrawal of Water |
| USGS Groundwater Use Information | Domestic |
| Data Source(s) | USGS |
| Location Data |
|---|
| TRS | NA03501021CBA |
| USGS TRS 1 | NA03501021CBA |
| Longitude/Latitude (NAD83) | -105.88863260 , 37.25973168 |
| Longitude/Latitude Data Source | GWSI decimal LAT/LONG field |
| USGS Longitude/Latitude (NAD83) | -105.8886326 , 37.25973168 |
| Easting, Northing RGDSS-NAD83 (US ft) | 137577.30 , 96125.95 |
| USGS Topography | Valley flat |
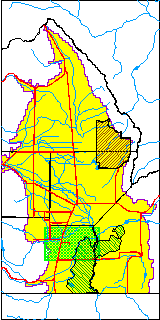
| USGS County | Conejos County |
| USGS Map Name | LA JARA |
| USGS Map Scale | 24000 |
| Elevation and Depth Data |
|---|
| Ground Elevation (ft NAVD88) | 7593.94000000000 |
| Elevation Data Source | USGS GWSI database |
| USGS Ground Elevation (ft NGVD29) | 7590.00 |
| 1/3-Arc Second NED Ground Elevation (ft NAVD88) | 7593.79 |
| 1-Arc Second NED Ground Elevation (ft NAVD88) | 7590.15 |
| SRTM Ground Elevation (ft NAVD88) | 7598.78 |
| Total Depth (ft) | 105.00 |
| USGS Well Depth (ft) | 105.00 |
| Model Layer | 2 |
| Model Layer Source | Well Depth |
| Depth of Bottom of Layer 1 | 36 |
| Depth of Bottom of Layer 2 | 291 |
| Depth of Bottom of Layer 3 | 504 |
| Depth of Bottom of Layer 4 | 1911 |
| Additional Well Information | Production, Construction |
| Aquifer Information |
|---|
| Aquifer Type | Confined |
| Aquifer Type Source | TD Elevation/Model Layer |
| USGS Hydrologic Unit | Alamosa-Trinchera |
| USGS Data Available | Water-level (GW.LEV) |
| Water-level Database Information |
|---|
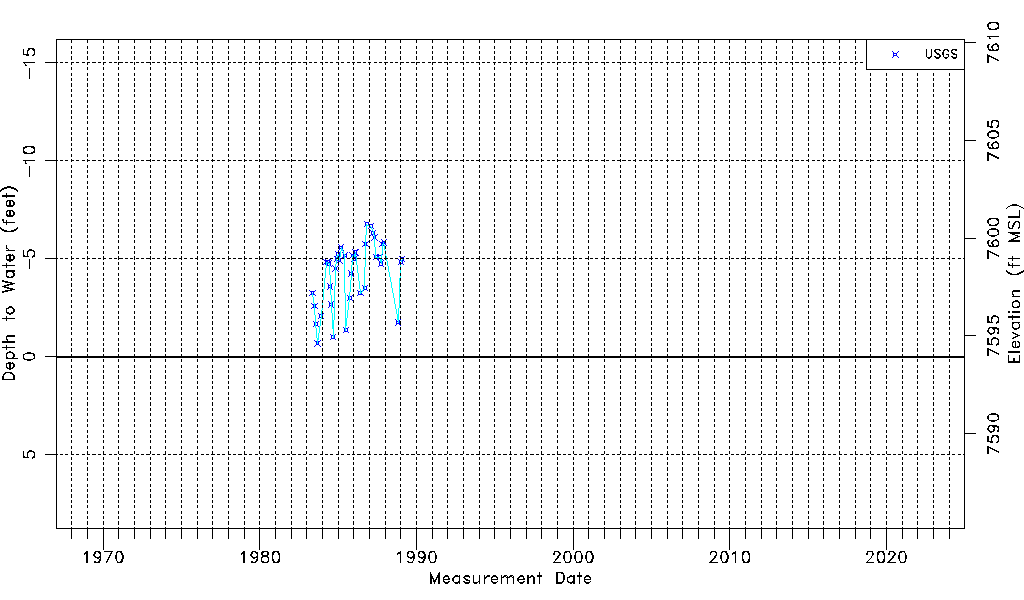
| Water-level Count | 39 |
| Water-level Date Range | 05/18/1983 thru 02/02/1989 |
| Monitored within the last 18 months | No, most recently on 02/02/1989 |
| Depth-to-Water Range (ft) | -6.77 to -0.68 |
| Water Table Elevation Range (ft NAVD88) | 7594.62 to 7600.71 |
| Water-Level-Source:Number-of-Measurements | USGS:39 |