| Well Information Table |
|---|
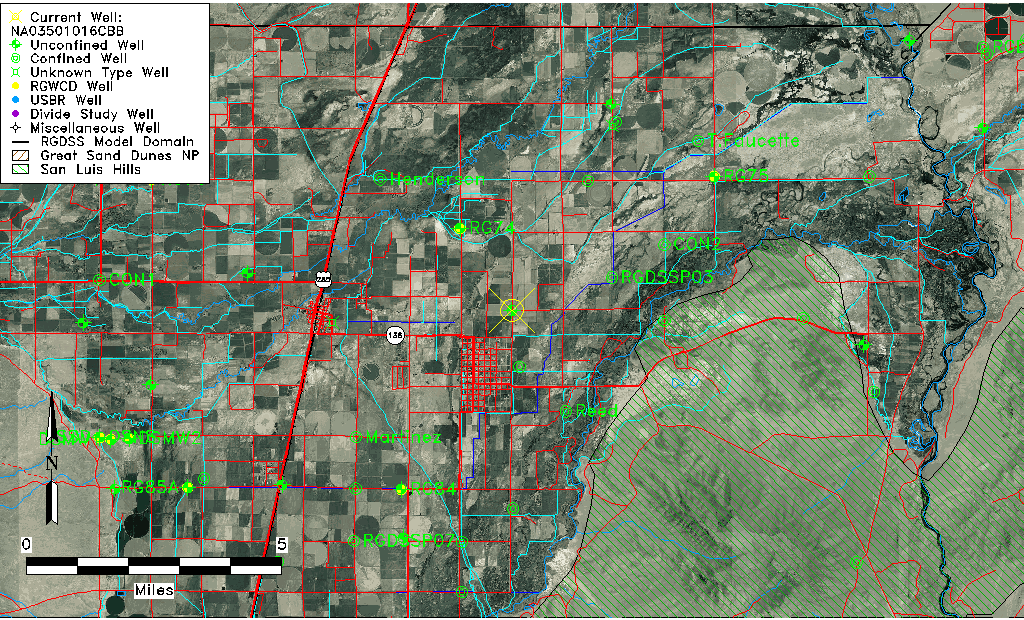
| Common Well ID | NA03501016CBB |
| USGS Well ID | 371612105533901 |
| USGS Station Name | NA03501016CBB |
| USGS Construction Date | 01/01/1966 |
| USGS Site Type | Well |
| USGS Site Use Information | Observation |
| USGS Groundwater Use Information | Unused |
| Data Source(s) | USGS |
| Location Data |
|---|
| TRS | NA03501016CBB |
| USGS TRS 1 | NA03501016CBB |
| USGS TRS | NWNWSWS016T0035NR0010EN |
| Longitude/Latitude (NAD83) | -105.89136050 , 37.27572573 |
| Longitude/Latitude Data Source | Davis Engineering Survey |
| USGS Longitude/Latitude (NAD83) | -105.8913549 , 37.27575906 |
| Easting, Northing RGDSS-NAD83 (US ft) | 136797.03 , 101949.55 |
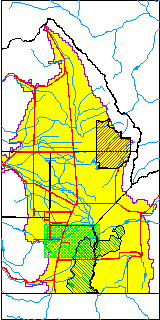
| USGS County | Conejos County |
| Elevation and Depth Data |
|---|
| Ground Elevation (ft NAVD88) | 7586.83000000000 |
| Elevation Data Source | Davis Engineering Survey |
| USGS Ground Elevation (ft NGVD29) | 7582.00 |
| 1/3-Arc Second NED Ground Elevation (ft NAVD88) | 7587.21 |
| 1-Arc Second NED Ground Elevation (ft NAVD88) | 7587.69 |
| SRTM Ground Elevation (ft NAVD88) | 7588.79 |
| Total Depth (ft) | 10.00 |
| USGS Well Depth (ft) | 10.00 |
| Model Layer | 1 |
| Model Layer Source | Well Depth |
| Depth of Bottom of Layer 1 | 34 |
| Depth of Bottom of Layer 2 | 322 |
| Depth of Bottom of Layer 3 | 559 |
| Depth of Bottom of Layer 4 | 2031 |
| Additional Well Information | Geohydrology, Construction |
| Aquifer Information |
|---|
| Aquifer Type | Unconfined |
| Aquifer Type Source | TD Elevation/Model Layer |
| USGS Primary Aquifer | Cenozoic Erathem |
| USGS Aquifer Type | Unconfined Single Aquifer |
| USGS Hydrologic Unit | Alamosa-Trinchera |
| USGS Data Available | Water-level (GW.LEV) |
| Water-level Database Information |
|---|
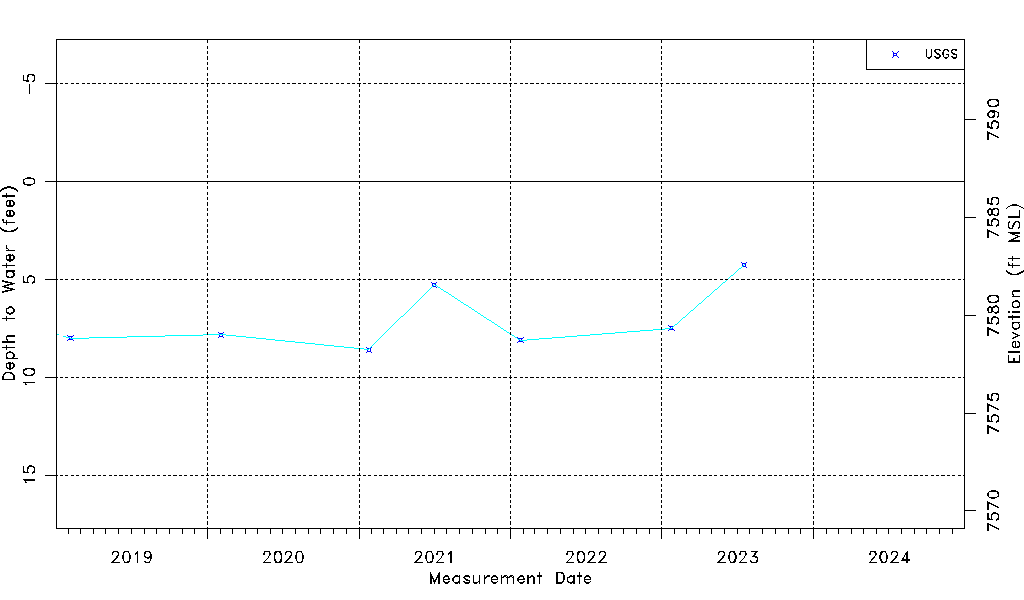
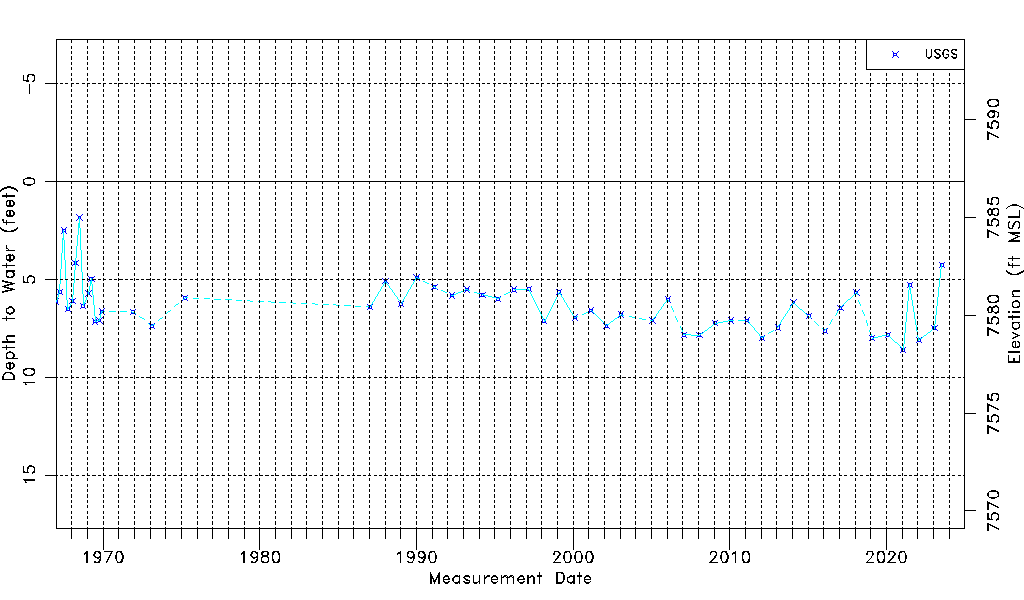
| Water-level Count | 54 |
| Water-level Date Range | 01/03/1967 thru 07/18/2023 |
| Monitored within the last 18 months | Yes, most recently on 07/18/2023 |
| Depth-to-Water Range (ft) | 1.84 to 8.61 |
| Water Table Elevation Range (ft NAVD88) | 7578.22 to 7584.99 |
| Water-Level-Source:Number-of-Measurements | USGS:54 |