| Well Information Table |
|---|
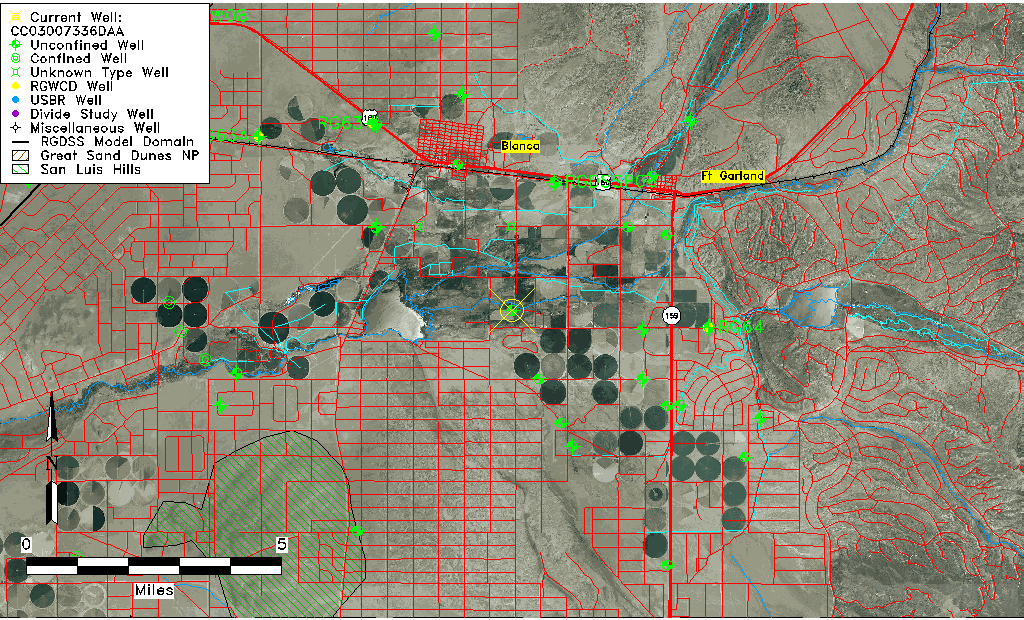
| Common Well ID | CC03007336DAA |
| USGS Well ID | 372337105291501 |
| USGS Station Name | CC03007336DAA |
| USGS Site Type | Well |
| USGS Site Use Information | Withdrawal of Water |
| USGS Groundwater Use Information | Unknown |
| Data Source(s) | USGS |
| Location Data |
|---|
| TRS | CC03007336DAA |
| USGS TRS 1 | CC03007336DAA |
| Longitude/Latitude (NAD83) | -105.48854000 , 37.39359238 |
| Longitude/Latitude Data Source | GWSI decimal LAT/LONG field |
| USGS Longitude/Latitude (NAD83) | -105.4885400 , 37.39359238 |
| Easting, Northing RGDSS-NAD83 (US ft) | 253882.44 , 144830.80 |
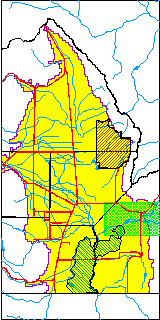
| USGS County | Costilla County |
| USGS Map Name | FORT GARLAND |
| USGS Map Scale | 24000 |
| Elevation and Depth Data |
|---|
| Ground Elevation (ft NAVD88) | 7768.41000000000 |
| Elevation Data Source | USGS GWSI database |
| USGS Ground Elevation (ft NGVD29) | 7764.00 |
| 1/3-Arc Second NED Ground Elevation (ft NAVD88) | 7764.36 |
| 1-Arc Second NED Ground Elevation (ft NAVD88) | 7763.66 |
| SRTM Ground Elevation (ft NAVD88) | 7787.26 |
| Total Depth (ft) | 79.00 |
| USGS Well Depth (ft) | 79.00 |
| Model Layer | 1 |
| Model Layer Source | Well Depth |
| Depth of Bottom of Layer 1 | 439 |
| Depth of Bottom of Layer 2 | 539 |
| Depth of Bottom of Layer 3 | 719 |
| Depth of Bottom of Layer 4 | 1602 |
| Additional Well Information | NONE |
| Aquifer Information |
|---|
| Aquifer Type | Unconfined |
| Aquifer Type Source | TD Elevation/Model Layer |
| USGS Hydrologic Unit | Alamosa-Trinchera |
| USGS Data Available | Water-level (GW.LEV) |
| Water-level Database Information |
|---|
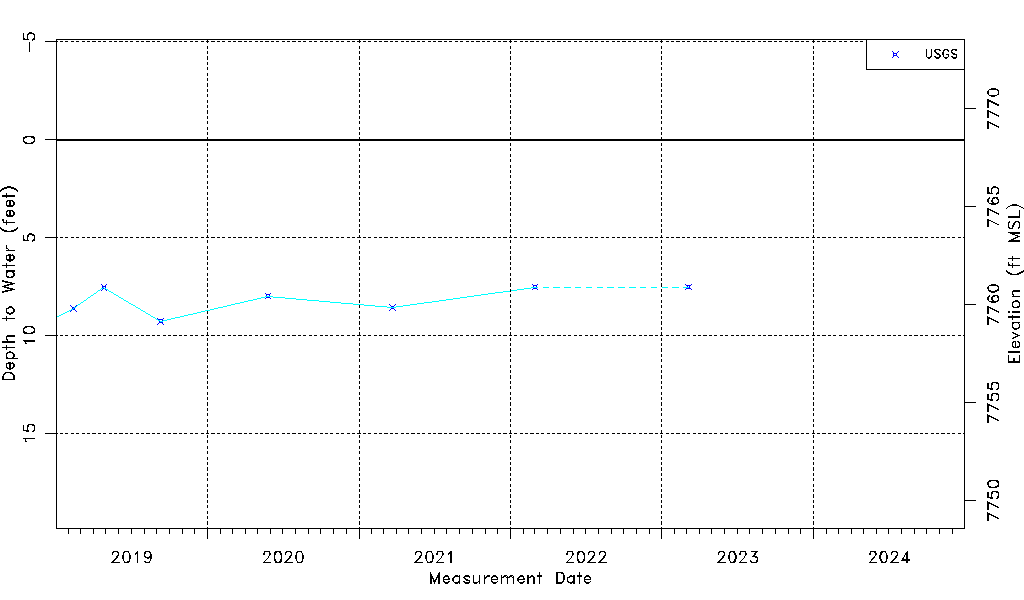
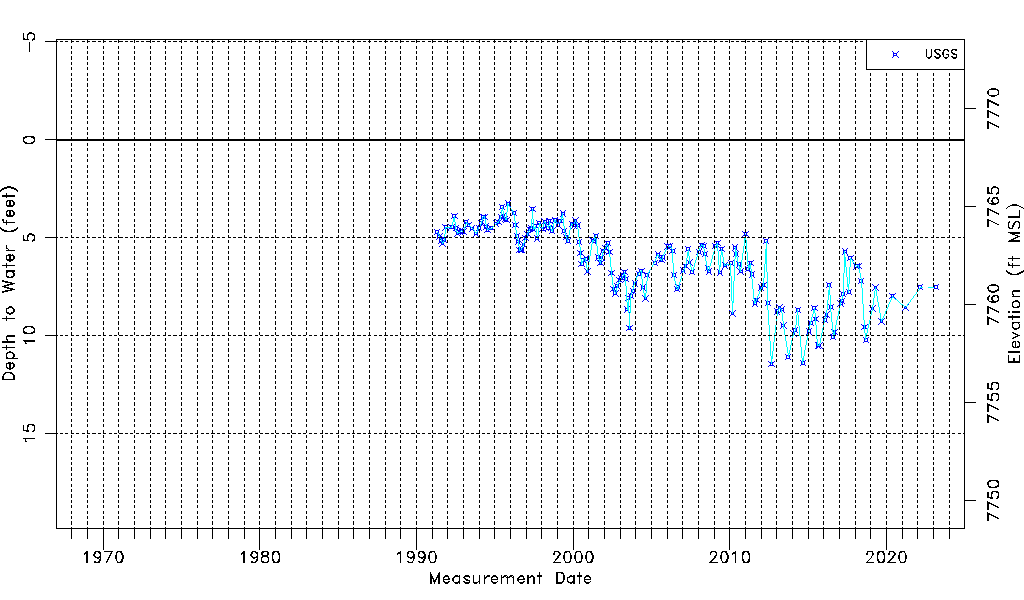
| Water-level Count | 185 |
| Water-level Date Range | 05/03/1991 thru 03/06/2023 |
| Monitored within the last 18 months | Yes, most recently on 03/06/2023 |
| Depth-to-Water Range (ft) | 3.26 to 11.44 |
| Water Table Elevation Range (ft NAVD88) | 7756.97 to 7765.15 |
| Water-Level-Source:Number-of-Measurements | USGS:185 |