| Well Information Table |
|---|
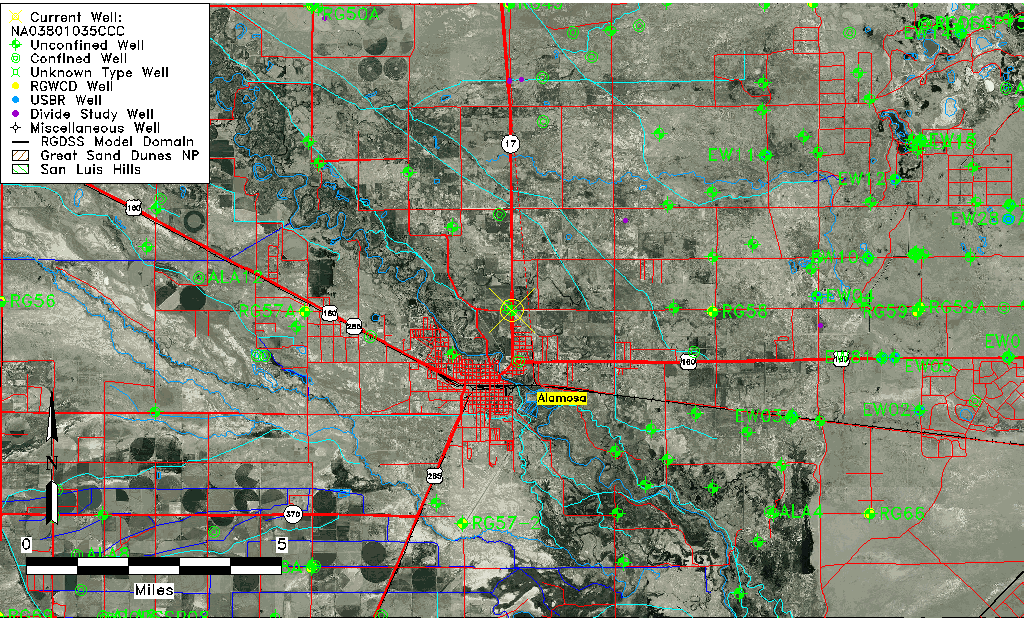
| Common Well ID | NA03801035CCC |
| USGS Well ID | 372854105513001 |
| USGS Station Name | NA03801035CCC |
| USGS Site Type | Well |
| USGS Site Use Information | Observation |
| USGS Groundwater Use Information | Unused |
| Data Source(s) | USGS, Divide Study |
| Location Data |
|---|
| TRS | NA03801035CCC |
| USGS TRS 1 | NA03801035CCC |
| USGS TRS | SWSWSWS035T0038NR0010EN |
| Longitude/Latitude (NAD83) | -105.85712571 , 37.48803677 |
| Longitude/Latitude Data Source | Divide Study |
| USGS Longitude/Latitude (NAD83) | -105.8571324 , 37.48803217 |
| Easting, Northing RGDSS-NAD83 (US ft) | 146906.73 , 179210.12 |
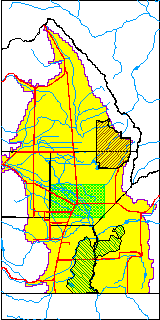
| USGS County | Alamosa County |
| Elevation and Depth Data |
|---|
| Ground Elevation (ft NAVD88) | 7544.14000000000 |
| Elevation Data Source | Divide study surveying by Davis Engineering |
| USGS Ground Elevation (ft NGVD29) | 7539.00 |
| 1/3-Arc Second NED Ground Elevation (ft NAVD88) | 7543.95 |
| 1-Arc Second NED Ground Elevation (ft NAVD88) | 7545.32 |
| SRTM Ground Elevation (ft NAVD88) | 7549.83 |
| Total Depth (ft) | 12.00 |
| USGS Well Depth (ft) | 12.00 |
| Model Layer | 1 |
| Model Layer Source | Aquifer Type |
| Depth of Bottom of Layer 1 | 84 |
| Depth of Bottom of Layer 2 | 403 |
| Depth of Bottom of Layer 3 | 754 |
| Depth of Bottom of Layer 4 | 2367 |
| Additional Well Information | Geohydrology, Construction |
| Aquifer Information |
|---|
| Aquifer Type | Unconfined |
| Aquifer Type Source | DIV_AQ |
| USGS Primary Aquifer | Cenozoic Erathem |
| USGS Aquifer Type | Unconfined Single Aquifer |
| USGS Hydrologic Unit | Alamosa-Trinchera |
| USGS Data Available | Water-level (GW.LEV) |
| Water-level Database Information |
|---|
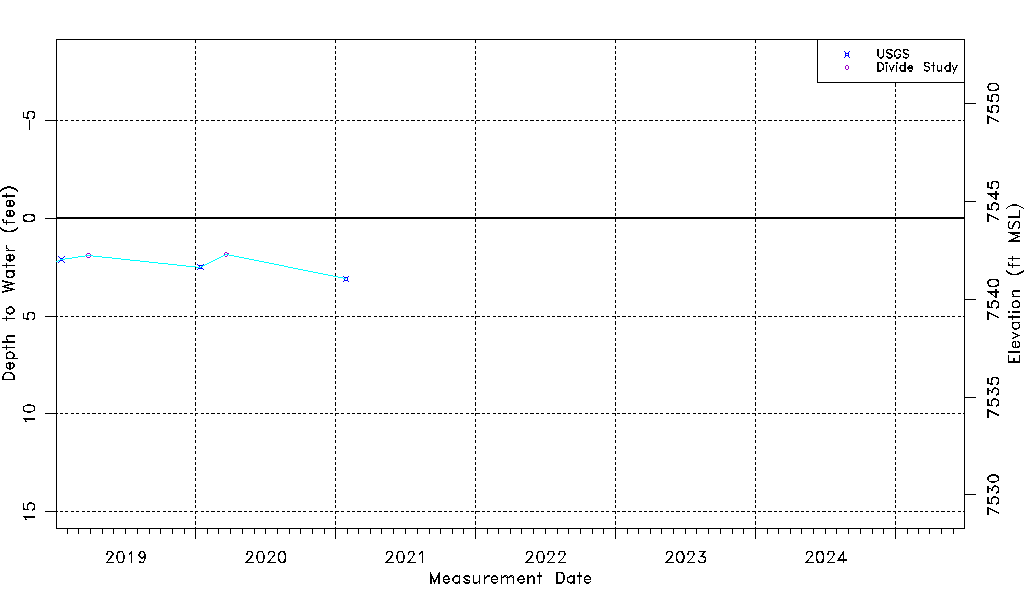
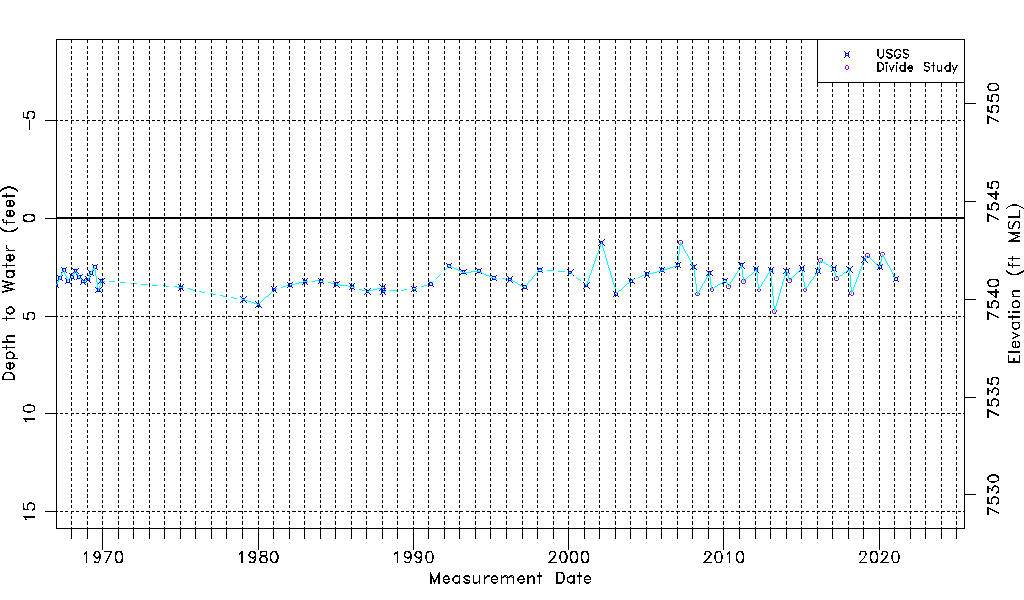
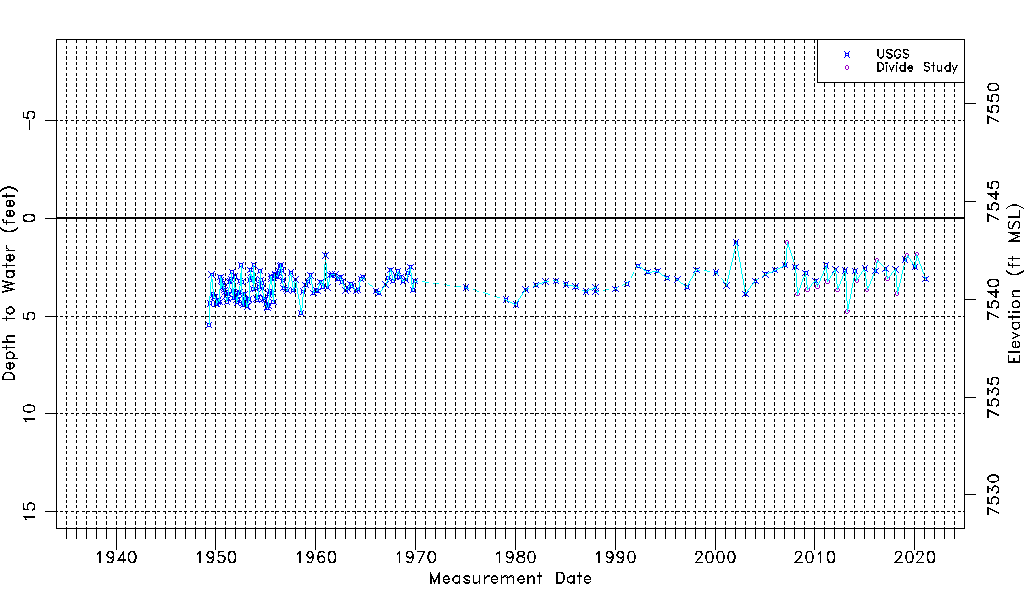
| Water-level Count | 192 |
| Water-level Date Range | 04/26/1949 thru 01/27/2021 |
| Monitored within the last 18 months | No, most recently on 01/27/2021 |
| Depth-to-Water Range (ft) | 1.25 to 5.45 |
| Water Table Elevation Range (ft NAVD88) | 7538.69 to 7542.89 |
| Water-Level-Source:Number-of-Measurements | USGS:178 Divide Study:14 |