| Well Information Table |
|---|
| Common Well ID | NA03801135BBB |
| USGS Well ID | 372930105450001 |
| USGS Station Name | NA03801135BBB |
| USGS Construction Date | 01/01/1967 |
| USGS Site Type | Well |
| USGS Site Use Information | Observation |
| USGS Groundwater Use Information | Unused |
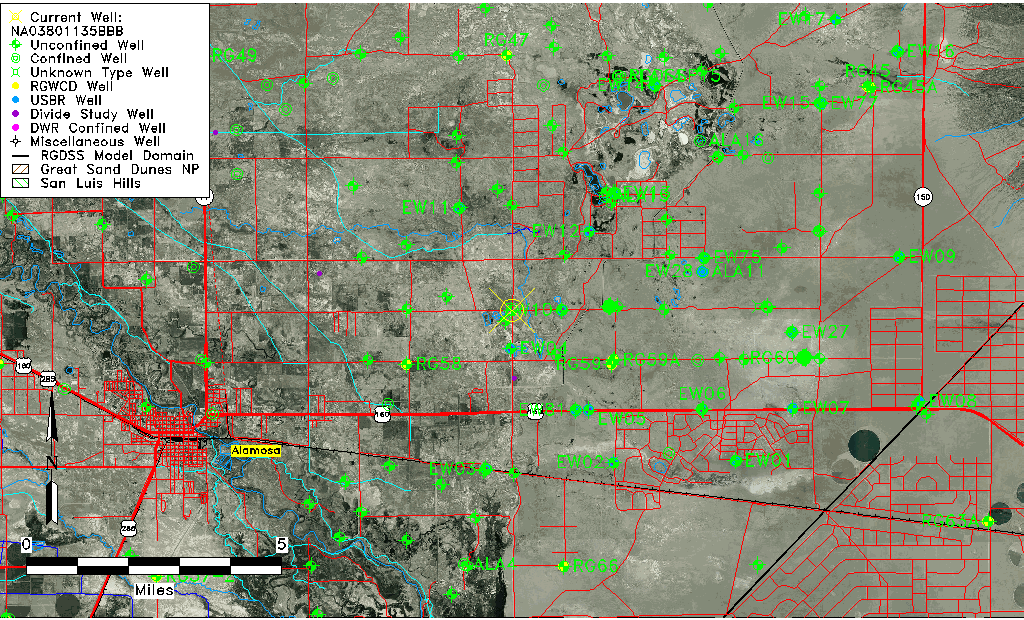
| Data Source(s) | USGS, Divide Study |
| Location Data |
|---|
| TRS | NA03801135BBB |
| USGS TRS 1 | NA03801135BBB |
| USGS TRS | NWNWNWS035T0038NR0011EN |
| Longitude/Latitude (NAD83) | -105.74814698 , 37.50304803 |
| Longitude/Latitude Data Source | Divide Study |
| USGS Longitude/Latitude (NAD83) | -105.7481576 , 37.50306030 |
| Easting, Northing RGDSS-NAD83 (US ft) | 178521.30 , 184629.90 |
| USGS Topography | Valley flat |
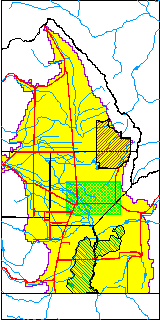
| USGS County | Alamosa County |
| USGS Map Name | DRY LAKES |
| USGS Map Scale | 24000 |
| Elevation and Depth Data |
|---|
| Ground Elevation (ft NAVD88) | 7526.43000000000 |
| Elevation Data Source | Divide study surveying by Davis Engineering |
| USGS Ground Elevation (ft NGVD29) | 7524.00 |
| 1/3-Arc Second NED Ground Elevation (ft NAVD88) | 7524.13 |
| 1-Arc Second NED Ground Elevation (ft NAVD88) | 7523.72 |
| SRTM Ground Elevation (ft NAVD88) | 7530.73 |
| Total Depth (ft) | 22.00 |
| USGS Well Depth (ft) | 22.00 |
| Model Layer | 1 |
| Model Layer Source | Aquifer Type |
| Depth of Bottom of Layer 1 | 64 |
| Depth of Bottom of Layer 2 | 326 |
| Depth of Bottom of Layer 3 | 793 |
| Depth of Bottom of Layer 4 | 2653 |
| Additional Well Information | Geohydrology, Construction |
| Aquifer Information |
|---|
| Aquifer Type | Unconfined |
| Aquifer Type Source | DIV_AQ |
| USGS Primary Aquifer | Cenozoic Erathem |
| USGS Aquifer Type | Unconfined Single Aquifer |
| USGS Hydrologic Unit | San Luis |
| USGS Data Available | Water-level (GW.LEV) |
| Water-level Database Information |
|---|
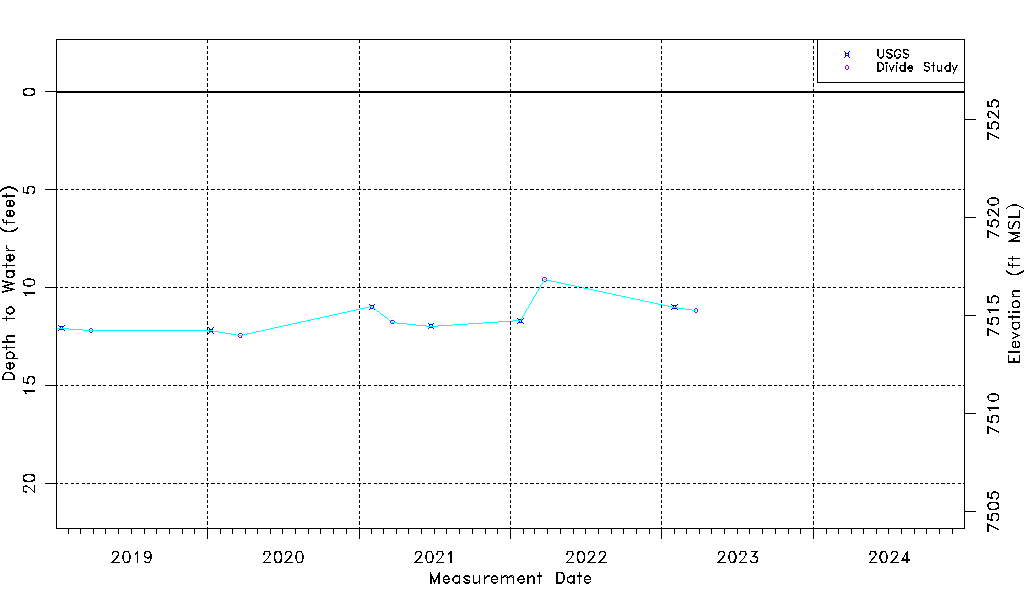
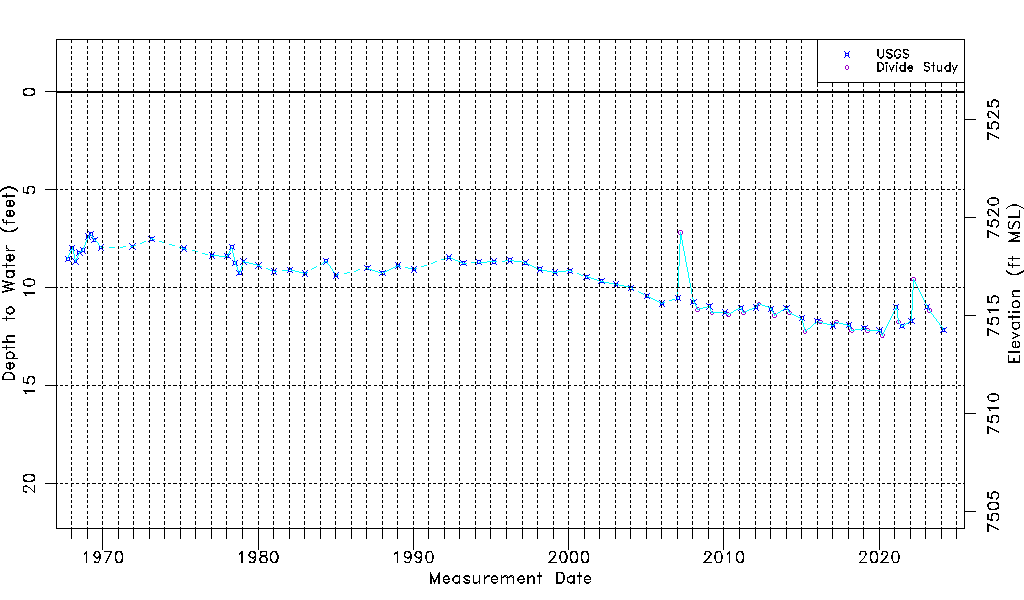
| Water-level Count | 78 |
| Water-level Date Range | 10/03/1967 thru 03/24/2023 |
| Monitored within the last 18 months | Yes, most recently on 03/24/2023 |
| Depth-to-Water Range (ft) | 7.17 to 12.42 |
| Water Table Elevation Range (ft NAVD88) | 7514.01 to 7519.26 |
| Water-Level-Source:Number-of-Measurements | USGS:61 Divide Study:17 |