| Well Information Table |
|---|
| Common Well ID | NA03800825DDD |
| USGS Well ID | 372953106023001 |
| USGS Station Name | NA03800825DDD |
| USGS Site Type | Well |
| USGS Site Use Information | Observation |
| USGS Groundwater Use Information | Unused |
| Data Source(s) | USGS |
| Location Data |
|---|
| TRS | NA03800825DDD |
| USGS TRS 1 | NA03800825DDD |
| USGS TRS | SESESES025T0038NR0008EN |
| Longitude/Latitude (NAD83) | -106.04224820 , 37.49805895 |
| Longitude/Latitude Data Source | GWSI decimal LAT/LONG field |
| USGS Longitude/Latitude (NAD83) | -106.0422482 , 37.49805895 |
| Easting, Northing RGDSS-NAD83 (US ft) | 93223.90 , 183017.65 |
| USGS Topography | Valley flat |
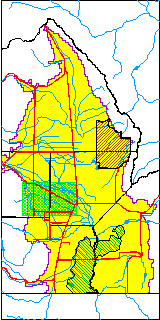
| USGS County | Rio Grande County |
| Elevation and Depth Data |
|---|
| Ground Elevation (ft NAVD88) | 7596.21000000000 |
| Elevation Data Source | USGS GWSI database |
| USGS Ground Elevation (ft NGVD29) | 7592.00 |
| 1/3-Arc Second NED Ground Elevation (ft NAVD88) | 7597.72 |
| 1-Arc Second NED Ground Elevation (ft NAVD88) | 7597.45 |
| SRTM Ground Elevation (ft NAVD88) | 7601.36 |
| Total Depth (ft) | 6.00 |
| USGS Well Depth (ft) | 6.00 |
| Model Layer | 1 |
| Model Layer Source | Well Depth |
| Depth of Bottom of Layer 1 | 45 |
| Depth of Bottom of Layer 2 | 213 |
| Depth of Bottom of Layer 3 | 698 |
| Depth of Bottom of Layer 4 | 2321 |
| Additional Well Information | Geohydrology, Construction |
| Aquifer Information |
|---|
| Aquifer Type | Unconfined |
| Aquifer Type Source | TD Elevation/Model Layer |
| USGS Primary Aquifer | Cenozoic Erathem |
| USGS Hydrologic Unit | Alamosa-Trinchera |
| USGS Data Available | Water-level (GW.LEV) |
| Water-level Database Information |
|---|
| Water-level Count | 122 |
| Water-level Date Range | 04/29/1949 thru 12/01/1969 |
| Monitored within the last 18 months | No, most recently on 12/01/1969 |
| Depth-to-Water Range (ft) | 0.62 to 5.12 |
| Water Table Elevation Range (ft NAVD88) | 7591.09 to 7595.59 |
| Water-Level-Source:Number-of-Measurements | USGSaguache Creek:122 |