Well NA03800831CCC
Unconfined


Home | Well Information | Hydrograph | Water Level Data Table
RGWCD Unconfined Wells:MapList
RGWCD Confined Wells:MapList
Baca Grant Wells:MapList
Divide Study Wells:MapList
Upper Rio Grande Wells:MapList
CWCD Wells:MapList
USBR Wells:MapList
USGS Wells:MapList
Dunes Hydro Study Wells:MapList
GSDNP Boundary Wells:MapList
Recently Monitored Wells:MapList
Unconfined Wells:MapList
Confined Wells:MapList

Index Map showing
model domain.

Green shaded area
enlarged below.

Click on map
to quickly move to
another location.


View Digital Orthophoto Quadrangle for this area

Well Information Table
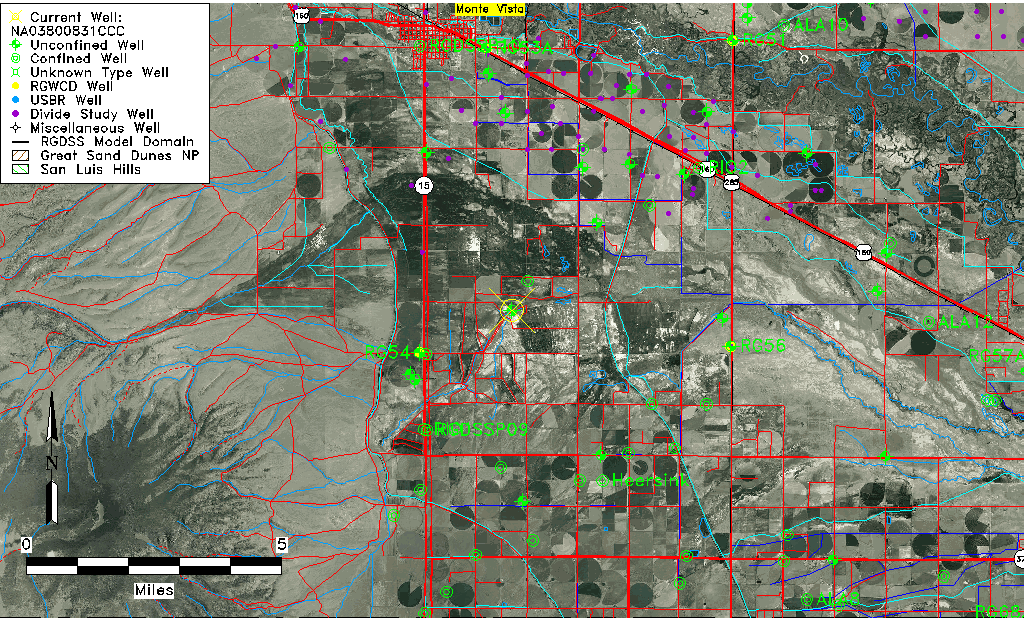
Common Well IDNA03800831CCC
USGS Well ID373000106070001
USGS Station NameNA03800831CCC
USGS Construction Date01/01/1949
USGS Site TypeWell
USGS Site Use InformationObservation
USGS Groundwater Use InformationUnused
Data Source(s)USGS
Location Data
TRSNA03800831CCC
USGS TRS 1NA03800831CCC
USGS TRSSWSWSWS031T0038NR0008EN
Longitude/Latitude (NAD83)-106.11725040 , 37.50000368
Longitude/Latitude Data SourceGWSI decimal LAT/LONG field
USGS Longitude/Latitude (NAD83)-106.1172504 , 37.50000368
Easting, Northing RGDSS-NAD83 (US ft)71474.35 , 183820.21
USGS TopographyFlat Surface
USGS CountyRio Grande County
Elevation and Depth Data
Ground Elevation (ft NAVD88)7658.34000000000
Elevation Data SourceUSGS GWSI database
USGS Ground Elevation (ft NGVD29)7654.00
1/3-Arc Second NED Ground Elevation (ft NAVD88)7623.10
1-Arc Second NED Ground Elevation (ft NAVD88)7619.56
SRTM Ground Elevation (ft NAVD88)7631.19
Total Depth (ft)8.00
USGS Well Depth (ft)8.00
Model Layer1
Model Layer SourceWell Depth
Depth of Bottom of Layer 170
Depth of Bottom of Layer 2189
Depth of Bottom of Layer 3310
Depth of Bottom of Layer 41906
Additional Well InformationGeohydrology, Construction
Aquifer Information
Aquifer TypeUnconfined
Aquifer Type SourceTD Elevation/Model Layer
USGS Primary AquiferCenozoic Erathem
USGS Hydrologic UnitAlamosa-Trinchera
USGS Data AvailableWater-level (GW.LEV)
Water-level Database Information
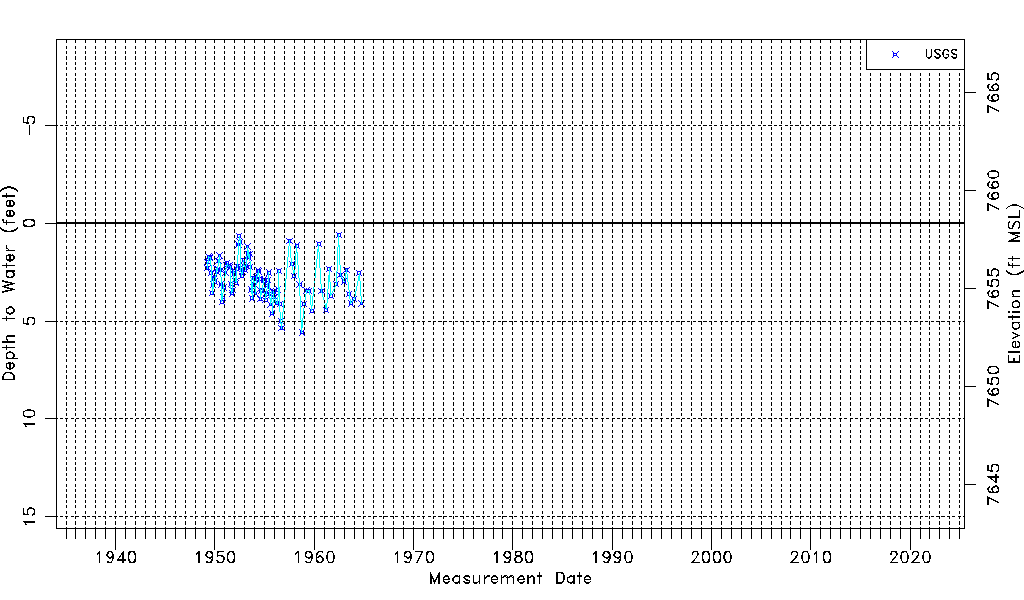
Water-level Count112
Water-level Date Range04/01/1949 thru 10/01/1964
Monitored within the last 18 monthsNo, most recently on 10/01/1964
Depth-to-Water Range (ft)0.60 to 5.59
Water Table Elevation Range (ft NAVD88)7652.75 to 7657.74
Water-Level-Source:Number-of-MeasurementsUSGSaguache Creek:112

Top of Page


Water-level Data

1934 to Present

Top of Page


Measurement DateDepth to
Water (ft)
Elevation
(ft NAVD88)
Data
Source(s)
04/01/19492.007656.34USGS
04/04/19492.307656.04USGS
05/13/19491.707656.64USGS
06/08/19491.737656.61USGS
07/12/19491.777656.57USGS
08/16/19492.547655.80USGS
09/19/19493.577654.77USGS
10/28/19493.137655.21USGS
11/23/19492.827655.52USGS
12/06/19492.847655.50USGS
01/12/19502.997655.35USGS
02/10/19502.317656.03USGS
03/08/19502.487655.86USGS
04/13/19502.377655.97USGS
05/10/19501.947656.40USGS
06/13/19501.657656.69USGS
07/18/19502.407655.94USGS
08/11/19503.137655.21USGS
09/11/19504.027654.32USGS
10/17/19503.807654.54USGS
11/17/19503.297655.05USGS
01/22/19512.527655.82USGS
02/19/19512.157656.19USGS
03/20/19512.047656.30USGS
04/24/19512.187656.16USGS
05/17/19512.227656.12USGS
06/12/19512.167656.18USGS
07/16/19512.247656.10USGS
08/10/19513.127655.22USGS
09/12/19513.597654.75USGS
10/12/19513.437654.91USGS
11/19/19512.437655.91USGS
12/06/19512.597655.75USGS
01/21/19522.987655.36USGS
02/13/19523.057655.29USGS
03/14/19522.357655.99USGS
04/09/19522.187656.16USGS
05/08/19521.097657.25USGS
06/12/19520.667657.68USGS
07/14/19520.967657.38USGS
08/06/19522.307656.04USGS
09/12/19522.717655.63USGS
10/08/19522.497655.85USGS
11/19/19521.907656.44USGS
12/08/19522.187656.16USGS
01/12/19532.387655.96USGS
02/05/19532.207656.14USGS
03/09/19532.167656.18USGS
04/07/19531.207657.14USGS
05/04/19531.607656.74USGS
06/01/19531.757656.59USGS
06/24/19531.597656.75USGS
07/23/19532.257656.09USGS
08/25/19533.407654.94USGS
09/28/19533.847654.50USGS
10/27/19533.277655.07USGS
11/24/19532.807655.54USGS
12/29/19533.137655.21USGS
01/25/19543.607654.74USGS
02/25/19542.757655.59USGS
03/23/19542.857655.49USGS
05/04/19542.427655.92USGS
06/08/19542.477655.87USGS
07/08/19542.877655.47USGS
08/06/19543.867654.48USGS
09/01/19543.487654.86USGS
10/05/19543.427654.92USGS
12/07/19542.887655.46USGS
02/08/19553.927654.42USGS
03/08/19553.547654.80USGS
04/05/19553.197655.15USGS
05/06/19552.917655.43USGS
06/02/19552.537655.81USGS
07/06/19553.627654.72USGS
08/04/19554.157654.19USGS
08/31/19553.477654.87USGS
10/05/19554.627653.72USGS
11/08/19553.557654.79USGS
11/29/19553.497654.85USGS
12/27/19553.767654.58USGS
03/08/19564.107654.24USGS
04/04/19564.097654.25USGS
05/08/19563.407654.94USGS
06/05/19562.437655.91USGS
07/09/19564.127654.22USGS
08/15/19564.997653.35USGS
09/14/19565.367652.98USGS
07/03/19570.907657.44USGS
09/30/19572.097656.25USGS
12/18/19572.717655.63USGS
03/27/19581.157657.19USGS
07/14/19583.137655.21USGS
09/29/19585.597652.75USGS
12/29/19584.127654.22USGS
03/16/19593.447654.90USGS
06/24/19593.467654.88USGS
10/07/19594.487653.86USGS
06/21/19601.087657.26USGS
09/25/19603.487654.86USGS
03/08/19614.437653.91USGS
07/03/19612.347656.00USGS
08/28/19613.727654.62USGS
03/21/19623.107655.24USGS
06/27/19620.607657.74USGS
08/28/19622.667655.68USGS
01/03/19632.987655.36USGS
04/03/19632.397655.95USGS
07/05/19633.637654.71USGS
09/02/19634.107654.24USGS
01/06/19643.867654.48USGS
07/06/19642.557655.79USGS
10/01/19644.107654.24USGS

Top of Page