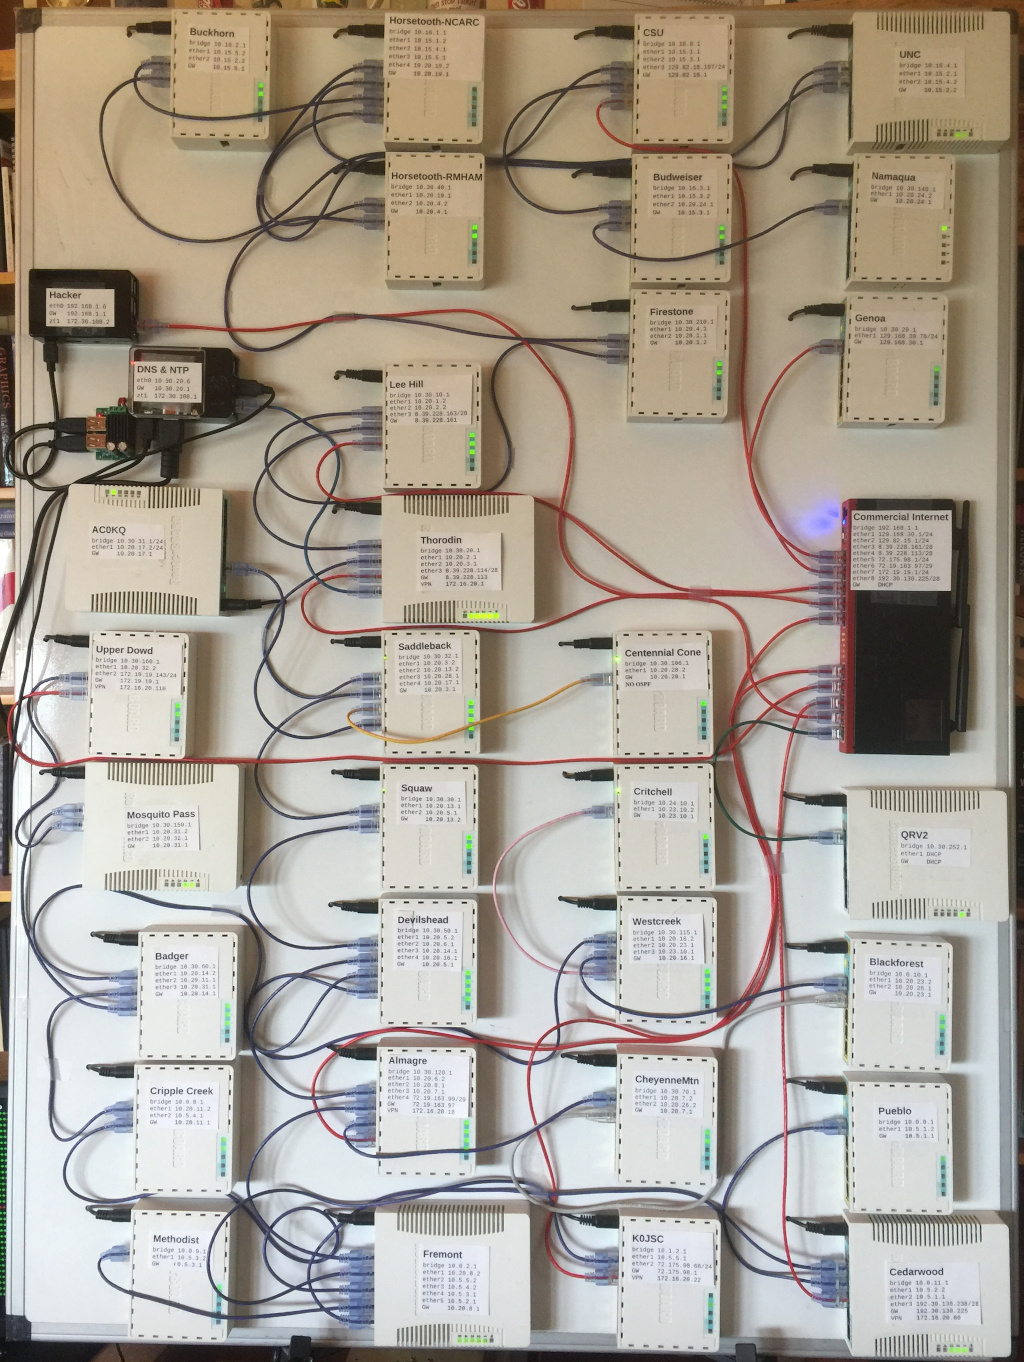
Figure 1. RMHAM Netlab
Starting in the spring of 2020, RMHAM NetOps started to notice excessive jitter on the network when the network was upgraded RouterOS 4.46. The jitter was particularly noticable on the P25 repeaters. Reverting some of the microwave links to RouterOS 6.45.9 significantly reduced jitter.
Further investigation shows that in addition to increased jitter on the microwave links, there is also significantly increased jitter on routers connected by ethernet. The exact source of the jitter remains unknown but it appears to have been introduced in RouterOS 6.46.2 and persists to various degrees until 6.47.1. RouterOS 6.47.3 results appear similar to 6.47.1.
Routeros 6.46.7 replaced Routeros 6.45.9 as the new Long Term Stable release on September 14, 2020. The jitter observed in this version is similar to RouterOS 6.47.3 and except for VPN connections is lower than that of 6.45.9.
Figure 1 is a photograph of the NetLab. Purple cables represent direct connections between routers. Red cables represent indirect connections between routers via the RB2011 which represents commercial internet links. The NetLab is normally used for training, demonstration and testing.
Two Raspberry Pi 3B computers are connected part of the NetLab. One is used to provide NTP, DNS and similar services. The other is connected to the RB2011 and is used for penetration testing of firewalls and similar functions.
Every router in the NetLab was configured with the same version of RouterOS. The Routerboard firmware was updated to match to RouterOS version. All routing was performed using OSPF. A separate subnet was created for every link between routers. Routers connected via the RB2011 runs a PPTP VPN with a high OSPF weight. These VPN connections were not selected because the direct connections provided a lower cost. During the experiments, no Dijkstras were run on any of the routers because the networks was stable and no packets wer lost.
Timing was generated using the cping program. The cping program sends one ICMP packet per second to each router in the network and measures the round trip time. Measurements were made from a Raspberry Pi 3B computer connected near the center of the network. The identical hardware configuration was used for all measurements.
For each experiment, the appropriate NPK was downloaded to each router. All routers were then rebooted twice, once to install the appropriate packages, and once to update the Routerboard firmware. The identical configuration was used on each router for all experiments.
The last experiment attempted to use RouterOS 7.1beta2, but the system failed to route appropriately with the existing configuration.
Ping times were recorded over a six hour period commencing withing a few minutes of rebooting all NetLab routers. Individual ping times were recorded to a file for 21600 pings (one ping per second for 6 hours). No packets were lost during any of the experiments.
Experiments were run for RouterOS 6.45.9, the last long term stable verion of the RouterOS 6.45 series, all stable verions of the RouterOS 6.46 and 6.47 series. The NPK for each version of RouterOS was downloaded from the https://download.mikrotik.com/routeros/XXX/routeros-mipsbe-XXX.npk where XXX represents the version of RouterOS.
Figure 2b. ICMP ping times RouterOS 6.46
Figure 2c. ICMP ping times RouterOS 6.46.1
Figure 2d. ICMP ping times RouterOS 6.46.2
Figure 2e. ICMP ping times RouterOS 6.46.3
Figure 2f. ICMP ping times RouterOS 6.46.4
Figure 2g. ICMP ping times RouterOS 6.46.5
Figure 2h. ICMP ping times RouterOS 6.46.6
Figure 2h. ICMP ping times RouterOS 6.46.7
Figure 2i. ICMP ping times RouterOS 6.47
Figure 2j. ICMP ping times RouterOS 6.47.1
Figure 2k. ICMP ping times RouterOS 6.47.2
Figure 2l. ICMP ping times RouterOS 6.47.3
The key result observed in Figure 2 is that starting with RouterOS 6.46.2, the jitter increased significantly. The median ping time remains about 1ms, but the at seemingly random intervals, ping times spike dramatically. No pings were lost, but times periodically spiked by one or two orders of magnitude.
To illustrate this behavior, Figure 3 shows a subset of the data from second 10000 for 10500.
Figure 3b. ICMP ping times RouterOS 6.46
Figure 3c. ICMP ping times RouterOS 6.46.1
Figure 3d. ICMP ping times RouterOS 6.46.2
Figure 3e. ICMP ping times RouterOS 6.46.3
Figure 3f. ICMP ping times RouterOS 6.46.4
Figure 3g. ICMP ping times RouterOS 6.46.5
Figure 3h. ICMP ping times RouterOS 6.46.6
Figure 3h. ICMP ping times RouterOS 6.46.7
Figure 3i. ICMP ping times RouterOS 6.47
Figure 3j. ICMP ping times RouterOS 6.47.1
Figure 3k. ICMP ping times RouterOS 6.47.2
Figure 3l. ICMP ping times RouterOS 6.47.3
Another interesting observation is that this behavior does not start immediately on rebooting the router. Figure 4 shows the first 30 minutes of each experiment.
Figure 4b. ICMP ping times RouterOS 6.46
Figure 4c. ICMP ping times RouterOS 6.46.1
Figure 4d. ICMP ping times RouterOS 6.46.2
Figure 4e. ICMP ping times RouterOS 6.46.3
Figure 4f. ICMP ping times RouterOS 6.46.4
Figure 4g. ICMP ping times RouterOS 6.46.5
Figure 4h. ICMP ping times RouterOS 6.46.6
Figure 4h. ICMP ping times RouterOS 6.46.7
Figure 4i. ICMP ping times RouterOS 6.47
Figure 4j. ICMP ping times RouterOS 6.47.1
Figure 4k. ICMP ping times RouterOS 6.47.2
Figure 4l. ICMP ping times RouterOS 6.47.3
The jitter was quantified by calculating the standard deviation of the ping times to each of the 32 routers. The results are shown in Figure 5.
Figure 5b. Standard Deviation of ICMP ping times for all LTS and latest verions.
Figure 5a shows that the dramatic increase in jutter for versions 6.46.2, 6.46.3 and 6.46.4 by router. Figure 5b shows just the two Long Term Stable versions 6.45.9 and 6.46.7 and the latest version 6.47.3. Figure 5b densonstartes that for many routers, teh standard deviation is significantly lower in version 6.46.7 than in 6.45.9. The Genoa router is connected over an SSTP VPN instead of a direct connection. This connection showed significantly more jitter than directly connected links, although the average ping time is essentially the same.
Detailed statistics are shown in Appendix 1.
A search of the Mikrotik forums showed no reports of the problem as detailed above. The source of the problem is not understood, but appears to have been resolved by RouterOS 6.47.2. The problem does appear to have resurfaced to a lesser extent in RouterOS 6.47.3 as it seems similar to 6.47.1.
The problem was readily apparrent when the production network was upgraded to RouterOS 6.46.6, but only by testing all versions in a controlled environment could this problem be isolated and evaluated.
Based on this experience, we recommend that the RMHAM network should only deploy the long term stable branch of RouterOS on the production network. The Long Term Stable branch receives security updates and therefore is as secure as later versions from the stable branch. There does not appear to be any advantages to using more recent versions of RouterOS 6.
The updated long term stable (LTS) RouterOS 6.46.7 appears to be well behaved and is an appropriate candidate for overwinter conditions 2020-2021.
Initial evaluation of RouterOS 7 did not go well. These problems may well be resolved by the time RouterOS 7 reaches Stable status, but significant testing should be performed before transitioning the network to RouterOS 7.
| RouterOS Version | Statistic | MtnBB | CSU | Budweiser | Buckhorn | UNC | Horsetooth NCARC | Horsetooth RMHAM | Firestone | Lee Hill | Thorodin | Saddleback | Squaw | Methodist | Devilshead | Almagre | Cheyenne Mountain | Black Forest | Fremont | K0JSC | Badger | Cripple Creek | Westcreek | Mosquito Pass | Upper Dowd | Cedarwood | Pueblo | Centennial Cone | AC0KQ | Genoa | Namaqua | Critchell | QRV2 |
|---|---|---|---|---|---|---|---|---|---|---|---|---|---|---|---|---|---|---|---|---|---|---|---|---|---|---|---|---|---|---|---|---|---|
| 6.45.9 | Minimum | 0.5 | 0.6 | 0.7 | 0.6 | 0.6 | 0.6 | 0.5 | 0.5 | 0.4 | 0.4 | 0.5 | 0.5 | 0.6 | 0.5 | 0.6 | 0.6 | 0.6 | 0.6 | 0.7 | 0.5 | 0.6 | 0.5 | 0.6 | 0.6 | 0.7 | 0.7 | 0.5 | 0.5 | 1.1 | 0.7 | 0.6 | 0.7 |
| Average | 0.6 | 1.0 | 0.9 | 0.8 | 0.8 | 0.7 | 0.7 | 0.7 | 0.6 | 0.6 | 0.6 | 0.7 | 0.9 | 0.7 | 0.7 | 0.8 | 0.8 | 0.8 | 0.9 | 0.7 | 0.8 | 0.7 | 0.7 | 0.8 | 0.9 | 0.9 | 0.7 | 0.6 | 1.6 | 1.0 | 0.8 | 0.9 | |
| Maximum | 24.8 | 13.3 | 13.2 | 13.0 | 32.5 | 13.2 | 13.0 | 13.3 | 12.2 | 12.4 | 11.9 | 12.4 | 12.8 | 39.2 | 39.3 | 38.2 | 36.9 | 35.8 | 34.6 | 33.3 | 32.1 | 30.9 | 29.7 | 28.6 | 27.3 | 26.2 | 24.9 | 23.7 | 72.8 | 21.3 | 20.1 | 18.9 | |
| StdDev | 0.4 | 0.3 | 0.3 | 0.3 | 0.4 | 0.3 | 0.3 | 0.3 | 0.3 | 0.3 | 0.3 | 0.3 | 0.3 | 0.4 | 0.4 | 0.4 | 0.4 | 0.4 | 0.4 | 0.4 | 0.4 | 0.4 | 0.3 | 0.3 | 0.3 | 0.3 | 0.3 | 0.3 | 1.5 | 0.3 | 0.3 | 0.3 | |
| 6.46 | Minimum | 0.5 | 0.7 | 0.7 | 0.6 | 0.6 | 0.6 | 0.6 | 0.5 | 0.5 | 0.4 | 0.5 | 0.5 | 0.7 | 0.5 | 0.6 | 0.6 | 0.6 | 0.6 | 0.7 | 0.5 | 0.6 | 0.5 | 0.6 | 0.6 | 0.7 | 0.7 | 0.5 | 0.5 | 1.1 | 0.8 | 0.6 | 0.7 |
| Average | 0.6 | 1.0 | 0.9 | 0.8 | 0.8 | 0.8 | 0.7 | 0.7 | 0.6 | 0.6 | 0.6 | 0.7 | 1.0 | 0.7 | 0.7 | 0.8 | 0.8 | 0.8 | 0.9 | 0.7 | 0.8 | 0.7 | 0.7 | 0.8 | 0.9 | 0.9 | 0.7 | 0.6 | 1.6 | 1.0 | 0.8 | 0.9 | |
| Maximum | 55.6 | 54.6 | 53.4 | 52.2 | 51.0 | 49.7 | 48.5 | 47.3 | 46.1 | 41.6 | 43.7 | 42.6 | 41.5 | 40.2 | 39.0 | 37.9 | 36.6 | 35.5 | 34.3 | 33.0 | 31.8 | 30.6 | 29.4 | 28.3 | 27.1 | 25.9 | 24.5 | 23.3 | 36.4 | 21.0 | 19.8 | 18.7 | |
| StdDev | 0.7 | 0.5 | 0.5 | 0.5 | 0.5 | 0.5 | 0.5 | 0.5 | 0.5 | 0.4 | 0.4 | 0.4 | 0.4 | 0.4 | 0.4 | 0.4 | 0.4 | 0.4 | 0.4 | 0.4 | 0.4 | 0.4 | 0.3 | 0.3 | 0.4 | 0.4 | 0.4 | 0.3 | 1.3 | 0.4 | 0.3 | 0.3 | |
| 6.46.1 | Minimum | 0.5 | 0.7 | 0.7 | 0.6 | 0.6 | 0.6 | 0.6 | 0.5 | 0.5 | 0.4 | 0.4 | 0.5 | 0.7 | 0.5 | 0.6 | 0.6 | 0.6 | 0.6 | 0.7 | 0.5 | 0.6 | 0.5 | 0.6 | 0.6 | 0.7 | 0.7 | 0.5 | 0.5 | 1.1 | 0.8 | 0.6 | 0.8 |
| Average | 0.6 | 1.0 | 0.9 | 0.8 | 0.8 | 0.7 | 0.7 | 0.7 | 0.6 | 0.6 | 0.6 | 0.7 | 1.0 | 0.7 | 0.7 | 0.8 | 0.8 | 0.8 | 0.9 | 0.7 | 0.8 | 0.7 | 0.7 | 0.8 | 0.9 | 0.9 | 0.7 | 0.6 | 1.6 | 1.0 | 0.8 | 0.9 | |
| Maximum | 39.7 | 12.6 | 13.2 | 13.0 | 12.4 | 12.0 | 13.1 | 12.4 | 11.9 | 12.4 | 11.4 | 13.1 | 13.1 | 12.2 | 13.2 | 89.0 | 87.7 | 86.6 | 85.4 | 84.1 | 82.9 | 81.6 | 80.5 | 79.3 | 78.1 | 76.9 | 75.6 | 74.4 | 74.7 | 72.1 | 70.9 | 69.7 | |
| StdDev | 0.4 | 0.2 | 0.2 | 0.2 | 0.2 | 0.2 | 0.3 | 0.2 | 0.2 | 0.2 | 0.2 | 0.2 | 0.2 | 0.2 | 0.2 | 0.6 | 0.6 | 0.6 | 0.6 | 0.6 | 0.6 | 0.6 | 0.6 | 0.6 | 0.6 | 0.6 | 0.5 | 0.5 | 1.6 | 0.5 | 0.5 | 0.5 | |
| 6.46.2 | Minimum | 0.5 | 0.7 | 0.7 | 0.6 | 0.6 | 0.6 | 0.6 | 0.5 | 0.5 | 0.4 | 0.5 | 0.5 | 0.7 | 0.5 | 0.6 | 0.6 | 0.6 | 0.6 | 0.7 | 0.5 | 0.6 | 0.5 | 0.6 | 0.6 | 0.7 | 0.7 | 0.5 | 0.5 | 1.1 | 0.8 | 0.6 | 0.7 |
| Average | 1.7 | 1.6 | 1.5 | 1.4 | 1.4 | 1.4 | 1.3 | 1.3 | 1.2 | 1.1 | 1.3 | 1.3 | 1.6 | 1.3 | 1.3 | 1.4 | 1.4 | 1.4 | 1.5 | 1.4 | 1.4 | 1.3 | 1.4 | 1.5 | 1.5 | 1.6 | 1.3 | 1.3 | 2.7 | 1.7 | 1.4 | 1.6 | |
| Maximum | 153.3 | 108.2 | 108.9 | 108.5 | 107.9 | 108.1 | 107.8 | 108.2 | 107.6 | 106.0 | 107.4 | 107.5 | 107.2 | 107.6 | 107.6 | 107.7 | 107.3 | 107.1 | 107.9 | 107.6 | 106.5 | 107.2 | 106.7 | 107.3 | 106.7 | 106.5 | 106.3 | 105.9 | 191.3 | 107.2 | 106.8 | 807.8 | |
| StdDev | 8.8 | 6.6 | 6.6 | 6.5 | 6.5 | 6.5 | 6.5 | 6.5 | 6.5 | 6.4 | 6.6 | 6.6 | 6.6 | 6.6 | 6.6 | 6.7 | 6.7 | 6.7 | 6.8 | 6.8 | 6.8 | 6.9 | 6.8 | 6.9 | 6.9 | 6.9 | 6.8 | 6.7 | 9.0 | 6.6 | 6.6 | 8.6 | |
| 6.46.3 | Minimum | 0.5 | 0.7 | 0.7 | 0.6 | 0.6 | 0.6 | 0.6 | 0.5 | 0.5 | 0.4 | 0.5 | 0.5 | 0.7 | 0.5 | 0.6 | 0.6 | 0.6 | 0.6 | 0.7 | 0.6 | 0.6 | 0.6 | 0.6 | 0.6 | 0.7 | 0.7 | 0.5 | 0.5 | 1.1 | 0.8 | 0.6 | 0.8 |
| Average | 1.0 | 1.0 | 0.9 | 0.8 | 0.8 | 0.8 | 0.7 | 0.7 | 0.6 | 0.6 | 0.6 | 0.7 | 1.0 | 0.7 | 0.7 | 0.8 | 0.8 | 0.8 | 0.9 | 0.7 | 0.8 | 0.7 | 0.7 | 0.8 | 0.9 | 0.9 | 0.7 | 0.6 | 2.0 | 1.0 | 0.8 | 0.9 | |
| Maximum | 105.1 | 84.1 | 82.9 | 81.6 | 80.4 | 79.2 | 77.9 | 76.7 | 75.5 | 71.7 | 73.1 | 71.9 | 70.9 | 69.5 | 68.4 | 67.2 | 66.0 | 64.8 | 63.7 | 62.3 | 61.2 | 59.9 | 58.7 | 57.6 | 56.4 | 55.2 | 53.8 | 57.2 | 107.6 | 50.3 | 49.0 | 47.9 | |
| StdDev | 5.2 | 0.7 | 0.7 | 0.7 | 0.6 | 0.6 | 0.6 | 0.6 | 0.6 | 0.6 | 0.6 | 0.6 | 0.6 | 0.5 | 0.5 | 0.5 | 0.5 | 0.5 | 0.5 | 0.5 | 0.5 | 0.5 | 0.4 | 0.4 | 0.4 | 0.4 | 0.4 | 0.5 | 5.9 | 0.4 | 0.4 | 0.4 | |
| 6.46.4 | Minimum | 0.5 | 0.7 | 0.7 | 0.6 | 0.6 | 0.6 | 0.5 | 0.5 | 0.5 | 0.4 | 0.5 | 0.5 | 0.6 | 0.5 | 0.5 | 0.6 | 0.6 | 0.6 | 0.7 | 0.5 | 0.6 | 0.5 | 0.6 | 0.6 | 0.7 | 0.7 | 0.5 | 0.5 | 1.1 | 0.8 | 0.6 | 0.7 |
| Average | 1.8 | 1.8 | 1.7 | 1.6 | 1.6 | 1.5 | 1.5 | 1.5 | 1.4 | 1.3 | 1.4 | 1.4 | 1.7 | 1.4 | 1.5 | 1.6 | 1.6 | 1.5 | 1.7 | 1.5 | 1.6 | 1.5 | 1.5 | 1.6 | 1.7 | 1.7 | 1.4 | 1.4 | 2.8 | 1.9 | 1.6 | 1.7 | |
| Maximum | 163.1 | 108.2 | 107.1 | 107.5 | 108.2 | 108.2 | 108.4 | 107.4 | 108.1 | 106.0 | 108.2 | 107.7 | 106.9 | 107.4 | 107.4 | 106.6 | 107.0 | 107.3 | 107.0 | 107.3 | 106.9 | 107.0 | 106.8 | 107.2 | 106.9 | 106.9 | 107.4 | 106.5 | 129.8 | 108.2 | 107.0 | 107.5 | |
| StdDev | 9.2 | 7.6 | 7.5 | 7.6 | 7.5 | 7.5 | 7.5 | 7.5 | 7.7 | 7.4 | 7.6 | 7.5 | 7.6 | 7.5 | 7.6 | 7.5 | 7.5 | 7.4 | 7.5 | 7.5 | 7.6 | 7.5 | 7.7 | 7.6 | 7.7 | 7.6 | 7.6 | 7.6 | 9.6 | 7.7 | 7.7 | 7.7 | |
| 6.46.5 | Minimum | 0.5 | 0.7 | 0.7 | 0.6 | 0.6 | 0.6 | 0.6 | 0.5 | 0.5 | 0.4 | 0.5 | 0.5 | 0.7 | 0.5 | 0.6 | 0.6 | 0.6 | 0.6 | 0.6 | 0.5 | 0.6 | 0.5 | 0.6 | 0.6 | 0.7 | 0.7 | 0.5 | 0.5 | 1.1 | 0.8 | 0.6 | 0.7 |
| Average | 1.7 | 1.7 | 1.6 | 1.5 | 1.5 | 1.4 | 1.4 | 1.4 | 1.3 | 1.2 | 1.3 | 1.3 | 1.6 | 1.4 | 1.4 | 1.5 | 1.5 | 1.4 | 1.6 | 1.4 | 1.4 | 1.4 | 1.4 | 1.5 | 1.5 | 1.6 | 1.3 | 1.3 | 2.7 | 1.7 | 1.4 | 1.6 | |
| Maximum | 130.4 | 108.7 | 107.4 | 108.4 | 107.2 | 106.4 | 107.5 | 108.2 | 107.3 | 105.4 | 107.5 | 108.1 | 107.9 | 107.2 | 106.9 | 107.3 | 107.2 | 106.8 | 107.3 | 106.5 | 105.4 | 107.1 | 106.2 | 106.3 | 106.5 | 106.6 | 106.9 | 106.3 | 111.1 | 106.5 | 106.6 | 107.4 | |
| StdDev | 8.9 | 7.0 | 7.0 | 7.0 | 6.9 | 6.8 | 6.8 | 6.9 | 7.0 | 6.7 | 6.9 | 6.9 | 7.0 | 7.0 | 6.9 | 6.9 | 6.9 | 6.9 | 6.9 | 6.8 | 6.7 | 6.9 | 6.9 | 6.9 | 6.9 | 6.9 | 6.9 | 6.9 | 8.9 | 6.8 | 6.8 | 6.8 | |
| 6.46.6 | Minimum | 0.5 | 0.7 | 0.7 | 0.6 | 0.6 | 0.6 | 0.6 | 0.5 | 0.5 | 0.4 | 0.5 | 0.5 | 0.6 | 0.5 | 0.6 | 0.6 | 0.6 | 0.6 | 0.7 | 0.5 | 0.6 | 0.5 | 0.6 | 0.6 | 0.7 | 0.7 | 0.5 | 0.5 | 1.1 | 0.8 | 0.6 | 0.7 |
| Average | 1.1 | 1.0 | 0.9 | 0.8 | 0.8 | 0.8 | 0.7 | 0.7 | 0.6 | 0.6 | 0.6 | 0.7 | 1.0 | 0.7 | 0.7 | 0.8 | 0.8 | 0.8 | 0.9 | 0.7 | 0.8 | 0.7 | 0.7 | 0.8 | 0.9 | 0.9 | 0.7 | 0.6 | 2.1 | 1.1 | 0.8 | 0.9 | |
| Maximum | 105.3 | 67.2 | 66.0 | 64.8 | 63.6 | 62.3 | 61.1 | 59.9 | 58.6 | 53.5 | 56.3 | 55.1 | 92.6 | 92.8 | 91.6 | 90.5 | 89.2 | 88.0 | 86.8 | 85.5 | 84.3 | 83.0 | 81.9 | 80.7 | 79.5 | 78.3 | 77.0 | 75.7 | 105.4 | 73.4 | 72.1 | 71.0 | |
| StdDev | 5.7 | 0.7 | 0.7 | 0.7 | 0.7 | 0.7 | 0.7 | 0.6 | 0.6 | 0.6 | 0.6 | 0.6 | 0.8 | 0.8 | 0.8 | 0.8 | 0.8 | 0.8 | 0.8 | 0.7 | 0.7 | 0.7 | 0.7 | 0.7 | 0.7 | 0.6 | 0.6 | 0.6 | 5.8 | 0.6 | 0.6 | 0.6 | |
| 6.46.7 | Minimum | 0.5 | 0.7 | 0.7 | 0.6 | 0.6 | 0.6 | 0.6 | 0.5 | 0.5 | 0.4 | 0.5 | 0.5 | 0.7 | 0.5 | 0.6 | 0.6 | 0.6 | 0.6 | 0.7 | 0.5 | 0.6 | 0.5 | 0.6 | 0.6 | 0.6 | 0.7 | 0.5 | 0.5 | 1.1 | 0.8 | 0.6 | 0.7 |
| Average | 0.6 | 1.0 | 0.9 | 0.8 | 0.8 | 0.7 | 0.7 | 0.7 | 0.6 | 0.6 | 0.6 | 0.7 | 1.0 | 0.7 | 0.7 | 0.8 | 0.8 | 0.8 | 0.9 | 0.7 | 0.8 | 0.7 | 0.7 | 0.8 | 0.9 | 0.9 | 0.7 | 0.6 | 1.9 | 1.1 | 0.8 | 0.9 | |
| Maximum | 63.5 | 3.4 | 6.6 | 2.6 | 2.7 | 3.0 | 1.9 | 9.8 | 11.1 | 9.9 | 6.0 | 4.8 | 3.5 | 11.3 | 10.0 | 8.7 | 7.4 | 6.2 | 4.9 | 3.5 | 3.1 | 2.9 | 3.1 | 4.8 | 4.7 | 4.7 | 4.0 | 3.7 | 77.5 | 3.9 | 2.6 | 4.4 | |
| StdDev | 0.5 | 0.1 | 0.1 | 0.0 | 0.0 | 0.0 | 0.0 | 0.1 | 0.1 | 0.1 | 0.1 | 0.1 | 0.1 | 0.1 | 0.1 | 0.1 | 0.1 | 0.1 | 0.1 | 0.1 | 0.1 | 0.1 | 0.1 | 0.1 | 0.1 | 0.1 | 0.1 | 0.1 | 3.2 | 0.1 | 0.1 | 0.1 | |
| 6.47 | Minimum | 0.5 | 0.7 | 0.7 | 0.6 | 0.6 | 0.6 | 0.5 | 0.5 | 0.5 | 0.4 | 0.5 | 0.5 | 0.6 | 0.5 | 0.5 | 0.6 | 0.6 | 0.6 | 0.7 | 0.5 | 0.6 | 0.5 | 0.6 | 0.6 | 0.6 | 0.7 | 0.5 | 0.5 | 1.1 | 0.7 | 0.6 | 0.7 |
| Average | 0.6 | 1.0 | 0.9 | 0.8 | 0.8 | 0.7 | 0.7 | 0.6 | 0.6 | 0.6 | 0.6 | 0.7 | 0.9 | 0.7 | 0.7 | 0.8 | 0.8 | 0.7 | 0.8 | 0.7 | 0.8 | 0.7 | 0.7 | 0.8 | 0.8 | 0.9 | 0.6 | 0.6 | 1.9 | 1.0 | 0.8 | 0.9 | |
| Maximum | 12.9 | 13.2 | 13.1 | 12.8 | 12.9 | 12.3 | 13.0 | 12.3 | 12.1 | 11.5 | 11.5 | 12.4 | 13.0 | 12.4 | 12.2 | 13.0 | 12.9 | 11.7 | 12.9 | 12.8 | 12.9 | 12.8 | 11.8 | 10.6 | 9.4 | 12.6 | 11.6 | 12.3 | 39.4 | 12.7 | 12.2 | 12.5 | |
| StdDev | 0.3 | 0.3 | 0.3 | 0.2 | 0.2 | 0.2 | 0.2 | 0.3 | 0.2 | 0.2 | 0.2 | 0.2 | 0.2 | 0.2 | 0.2 | 0.2 | 0.2 | 0.2 | 0.2 | 0.2 | 0.3 | 0.3 | 0.2 | 0.2 | 0.2 | 0.2 | 0.2 | 0.2 | 3.1 | 0.2 | 0.2 | 0.2 | |
| 6.47.1 | Minimum | 0.5 | 0.7 | 0.7 | 0.6 | 0.6 | 0.6 | 0.5 | 0.5 | 0.5 | 0.4 | 0.5 | 0.5 | 0.6 | 0.5 | 0.5 | 0.6 | 0.6 | 0.6 | 0.6 | 0.5 | 0.6 | 0.5 | 0.6 | 0.6 | 0.6 | 0.7 | 0.5 | 0.5 | 1.1 | 0.7 | 0.6 | 0.7 |
| Average | 0.6 | 1.0 | 0.8 | 0.8 | 0.8 | 0.7 | 0.7 | 0.6 | 0.6 | 0.6 | 0.6 | 0.7 | 0.9 | 0.7 | 0.7 | 0.8 | 0.8 | 0.7 | 0.8 | 0.7 | 0.7 | 0.7 | 0.7 | 0.8 | 0.8 | 0.9 | 0.6 | 0.6 | 1.9 | 1.0 | 0.8 | 0.9 | |
| Maximum | 11.5 | 9.8 | 8.6 | 7.3 | 6.1 | 5.2 | 5.6 | 4.3 | 3.1 | 2.8 | 10.3 | 9.0 | 7.7 | 6.5 | 5.3 | 4.1 | 5.3 | 4.1 | 3.7 | 2.5 | 3.4 | 10.0 | 8.8 | 7.6 | 6.4 | 5.2 | 4.0 | 4.5 | 38.8 | 9.4 | 2.4 | 3.5 | |
| StdDev | 0.2 | 0.1 | 0.1 | 0.1 | 0.1 | 0.1 | 0.1 | 0.1 | 0.0 | 0.0 | 0.1 | 0.1 | 0.1 | 0.1 | 0.1 | 0.1 | 0.1 | 0.1 | 0.1 | 0.0 | 0.0 | 0.1 | 0.1 | 0.1 | 0.1 | 0.1 | 0.1 | 0.1 | 3.2 | 0.1 | 0.0 | 0.1 | |
| 6.47.2 | Minimum | 0.4 | 0.6 | 0.7 | 0.6 | 0.6 | 0.6 | 0.5 | 0.5 | 0.5 | 0.4 | 0.5 | 0.5 | 0.6 | 0.5 | 0.5 | 0.6 | 0.6 | 0.6 | 0.6 | 0.5 | 0.6 | 0.5 | 0.6 | 0.6 | 0.6 | 0.7 | 0.5 | 0.5 | 1.0 | 0.7 | 0.6 | 0.7 |
| Average | 0.6 | 1.0 | 0.9 | 0.8 | 0.8 | 0.7 | 0.7 | 0.7 | 0.6 | 0.6 | 0.6 | 0.7 | 0.9 | 0.7 | 0.7 | 0.8 | 0.8 | 0.7 | 0.8 | 0.7 | 0.8 | 0.7 | 0.7 | 0.8 | 0.8 | 0.9 | 0.6 | 0.6 | 1.6 | 1.0 | 0.8 | 0.9 | |
| Maximum | 12.4 | 12.8 | 12.8 | 12.4 | 13.0 | 13.3 | 12.4 | 12.5 | 12.8 | 12.1 | 12.5 | 12.5 | 13.2 | 12.4 | 12.3 | 12.7 | 12.5 | 12.5 | 12.6 | 12.6 | 12.9 | 12.5 | 12.6 | 12.7 | 12.8 | 12.2 | 10.8 | 12.4 | 35.9 | 12.8 | 12.5 | 12.7 | |
| StdDev | 0.4 | 0.3 | 0.3 | 0.3 | 0.3 | 0.3 | 0.3 | 0.3 | 0.3 | 0.3 | 0.3 | 0.3 | 0.3 | 0.3 | 0.3 | 0.3 | 0.3 | 0.3 | 0.3 | 0.3 | 0.3 | 0.3 | 0.3 | 0.3 | 0.3 | 0.3 | 0.2 | 0.3 | 1.3 | 0.3 | 0.3 | 0.3 | |
| 6.47.3 | Minimum | 0.4 | 0.6 | 0.7 | 0.6 | 0.6 | 0.6 | 0.5 | 0.5 | 0.4 | 0.4 | 0.4 | 0.5 | 0.6 | 0.5 | 0.5 | 0.6 | 0.6 | 0.6 | 0.6 | 0.5 | 0.6 | 0.5 | 0.5 | 0.6 | 0.6 | 0.7 | 0.5 | 0.5 | 1.1 | 0.7 | 0.6 | 0.6 |
| Average | 0.6 | 1.0 | 0.8 | 0.8 | 0.8 | 0.7 | 0.7 | 0.6 | 0.6 | 0.5 | 0.6 | 0.6 | 0.9 | 0.6 | 0.7 | 0.8 | 0.8 | 0.7 | 0.8 | 0.7 | 0.8 | 0.7 | 0.7 | 0.8 | 0.9 | 0.9 | 0.7 | 0.6 | 1.9 | 1.0 | 0.8 | 0.9 | |
| Maximum | 10.5 | 6.3 | 4.9 | 3.6 | 3.5 | 6.0 | 3.2 | 3.1 | 1.9 | 2.8 | 4.6 | 3.3 | 2.9 | 3.2 | 2.2 | 3.3 | 4.0 | 6.0 | 7.5 | 7.8 | 6.7 | 5.4 | 4.5 | 4.2 | 13.1 | 11.8 | 10.5 | 9.2 | 39.7 | 7.1 | 5.8 | 4.6 | |
| StdDev | 0.2 | 0.1 | 0.1 | 0.0 | 0.1 | 0.1 | 0.0 | 0.0 | 0.0 | 0.0 | 0.0 | 0.0 | 0.1 | 0.0 | 0.0 | 0.0 | 0.1 | 0.1 | 0.1 | 0.1 | 0.1 | 0.1 | 0.1 | 0.1 | 0.2 | 0.2 | 0.2 | 0.1 | 2.9 | 0.1 | 0.1 | 0.1 |